
Emissions from international shipping - in 2018
The primary goal of this study was to visualize findings using data from the International Maritime Organization (IMO) and various global emission sectors for a comprehensive analysis.
Background: This semester's course from 2018, taught by Professor Boris Müller, was designed to familiarize students with climate change and its effects.
"The course will develop visualizations to explore, understand and use climate scenarios."
- Prof. Boris Müller
- Prof. Boris Müller
Data research, looking for data

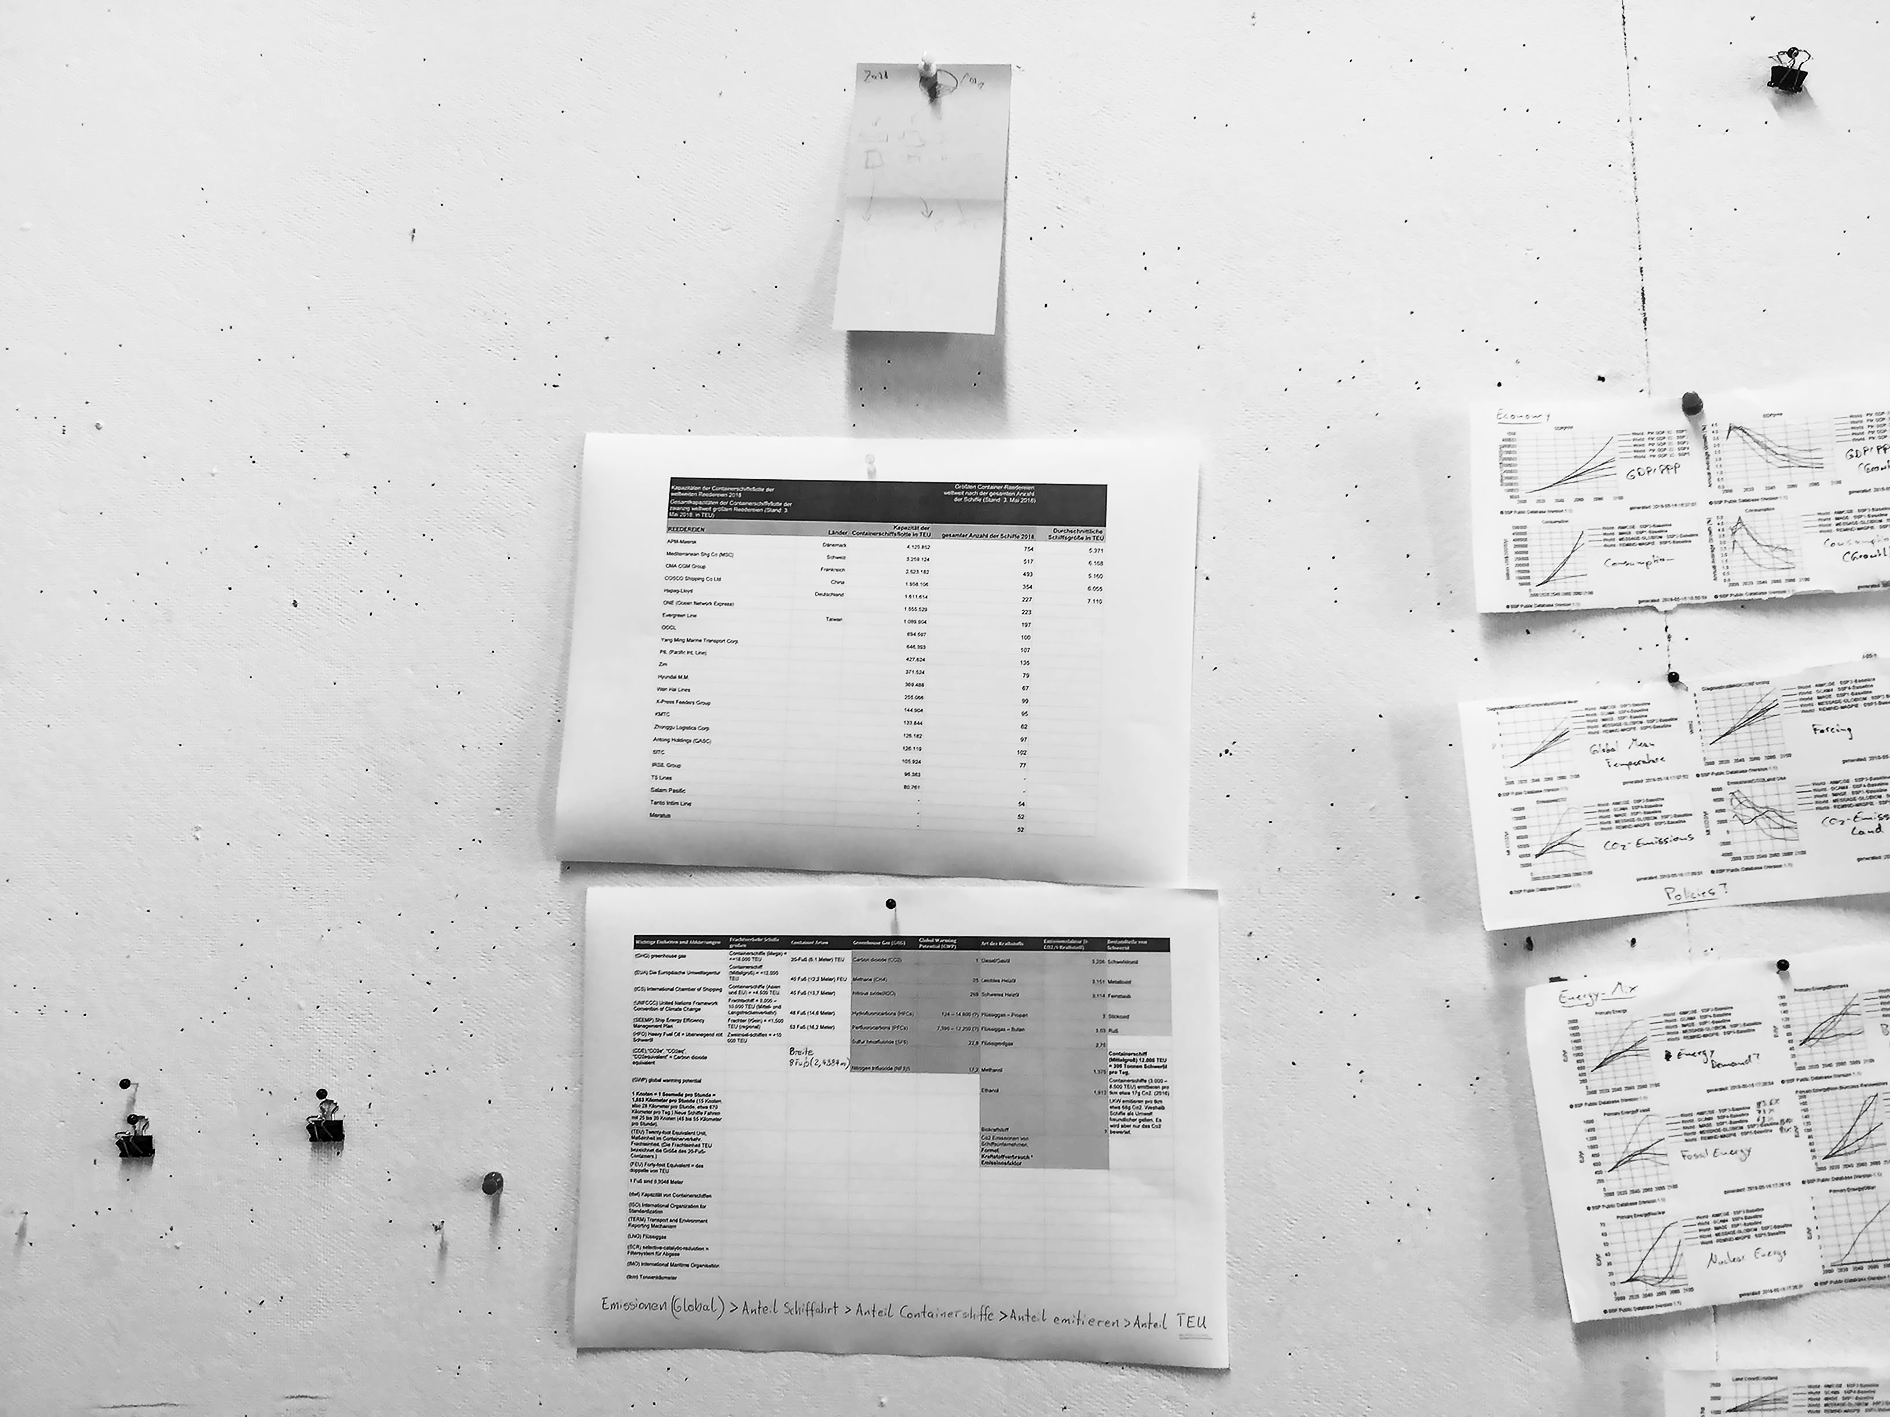
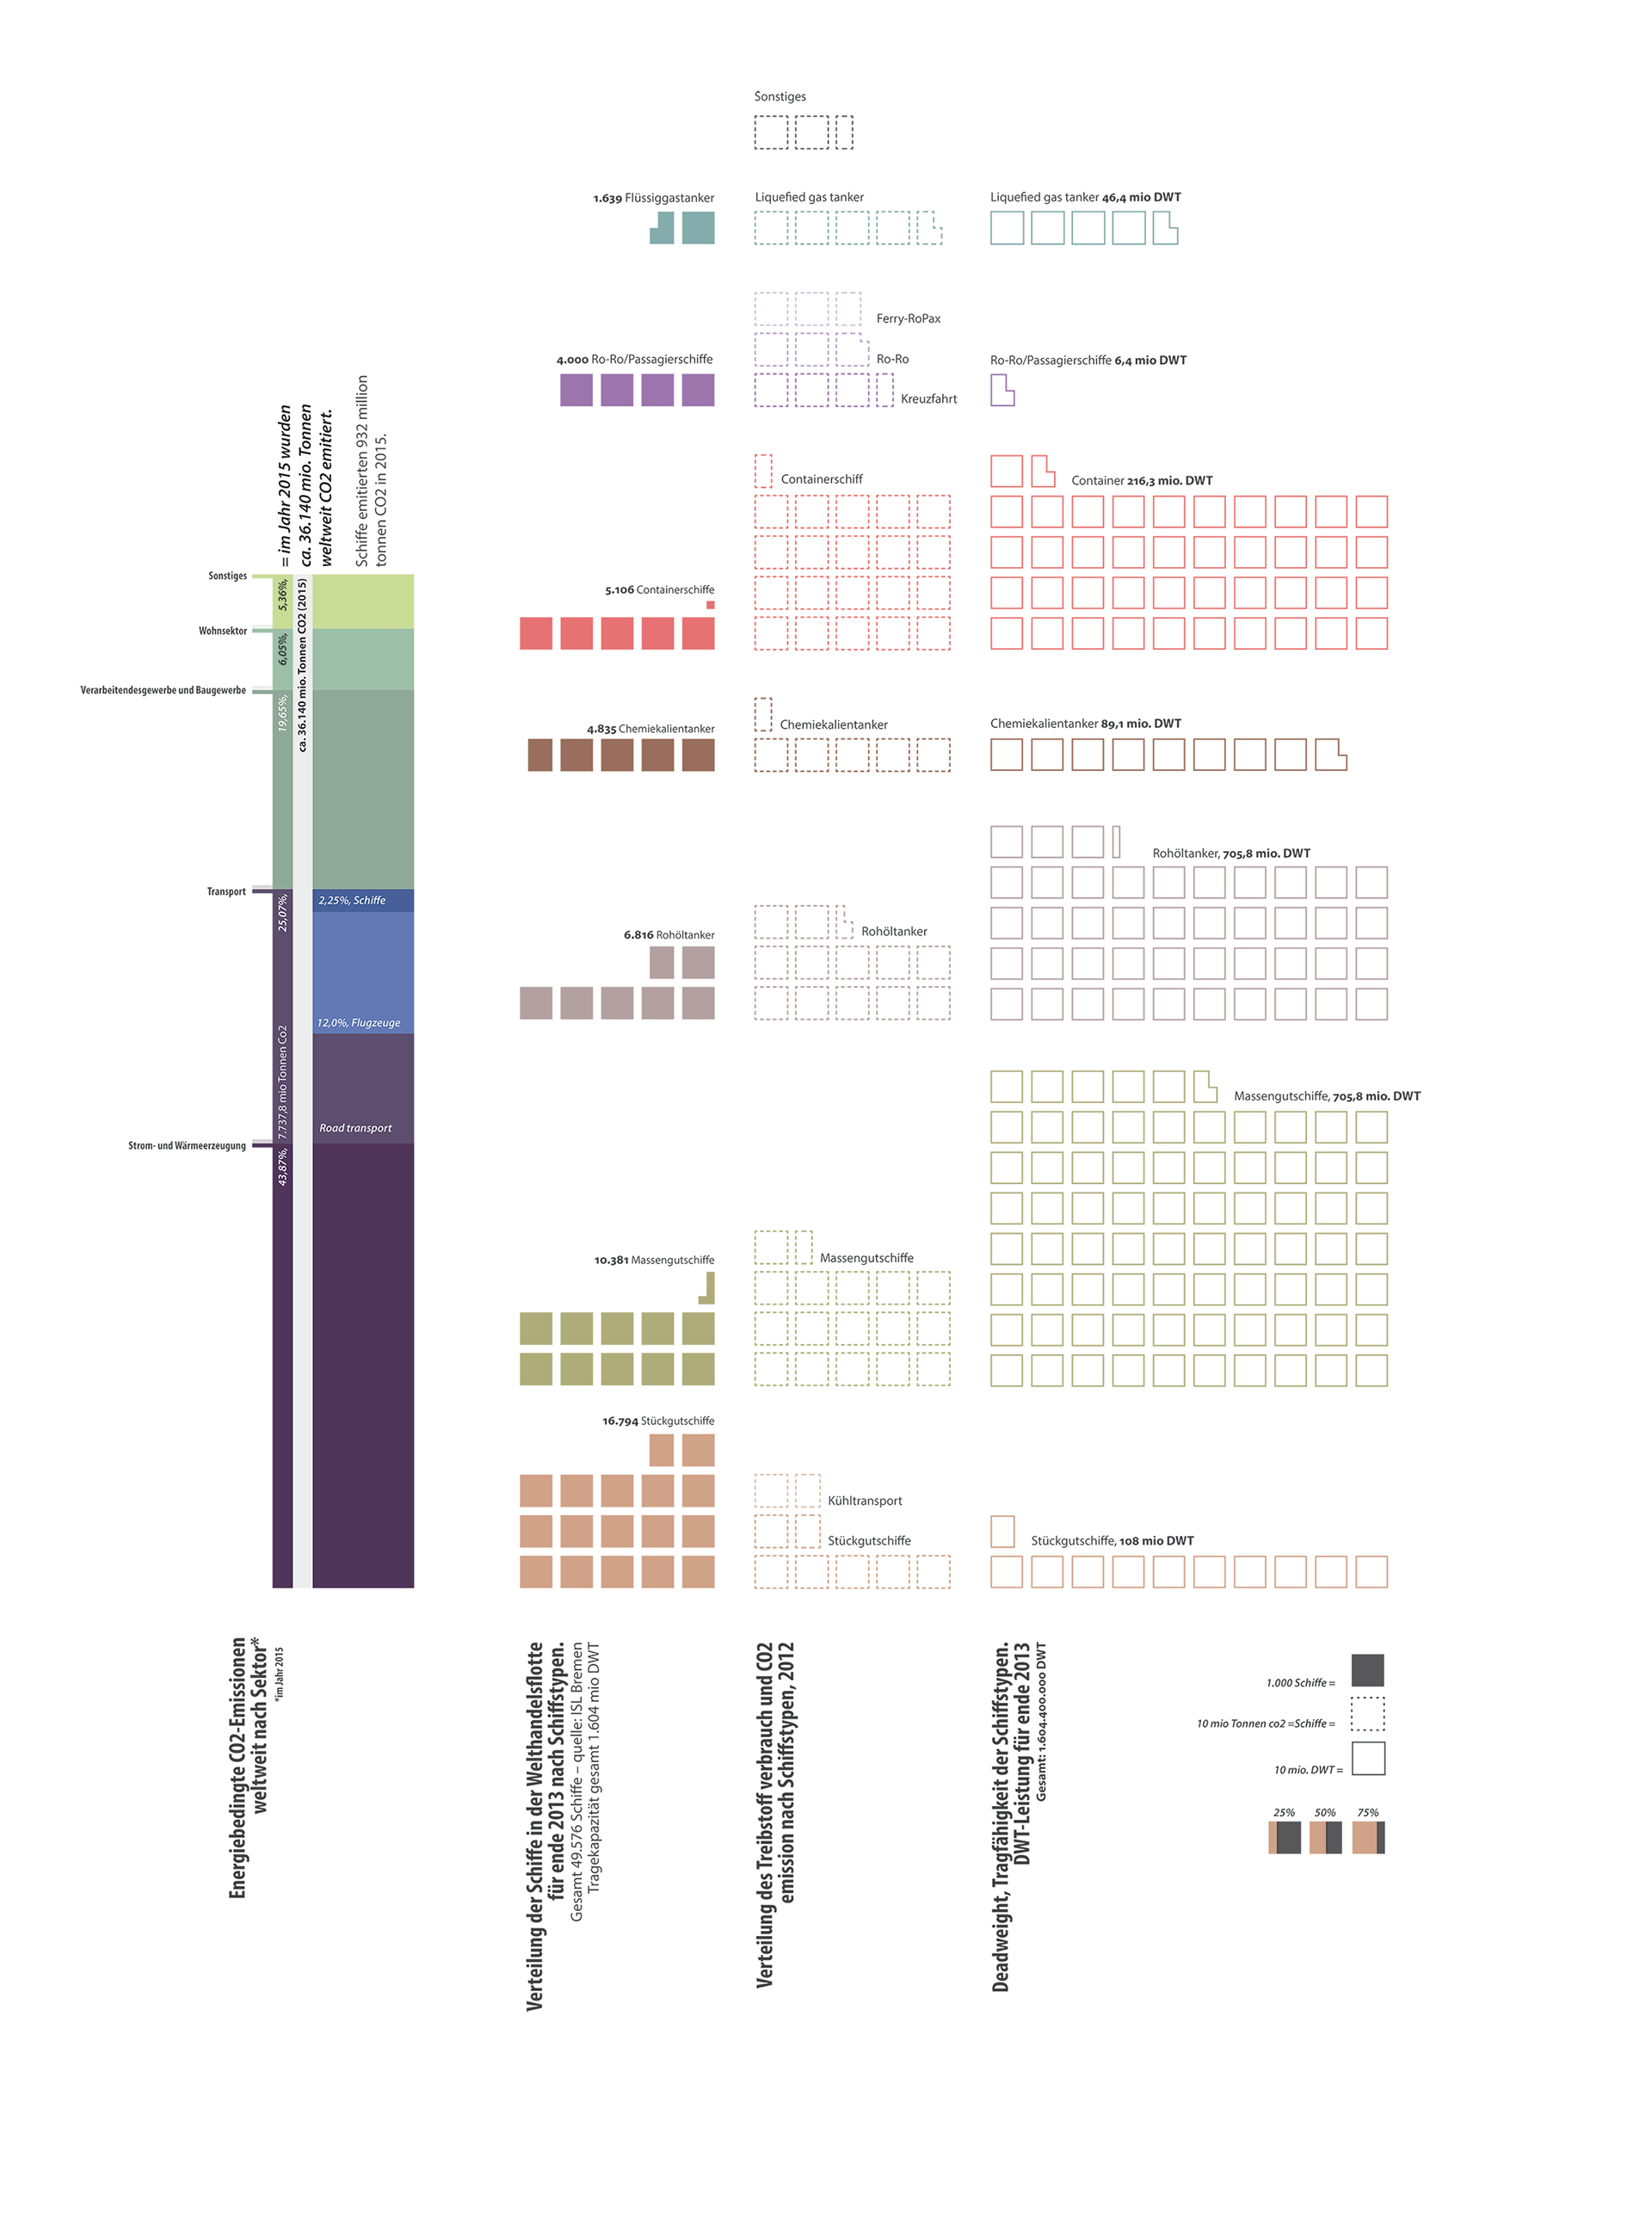
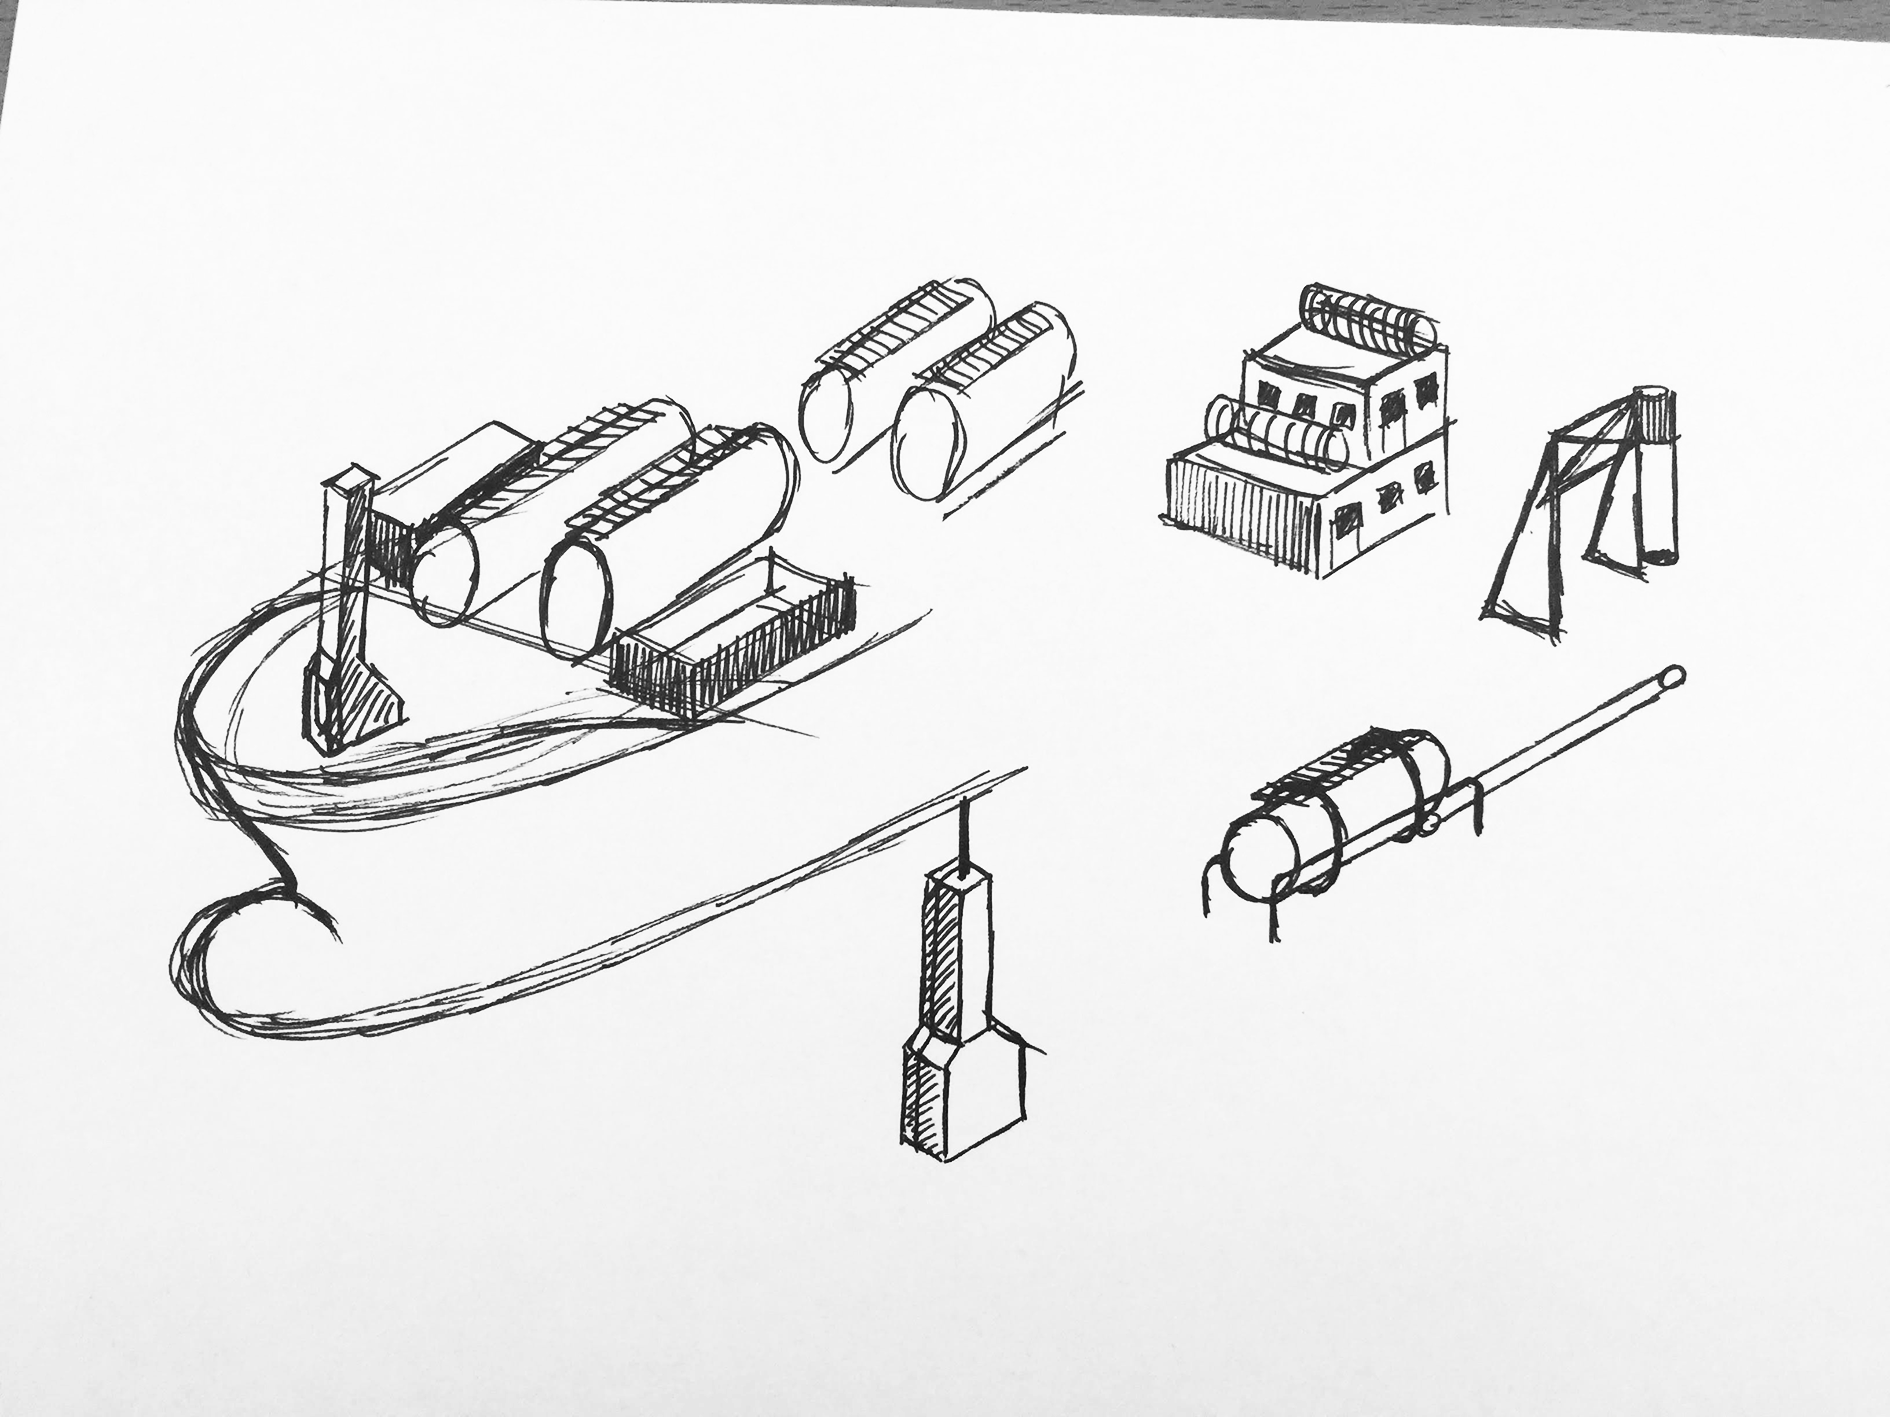
Illustration Process

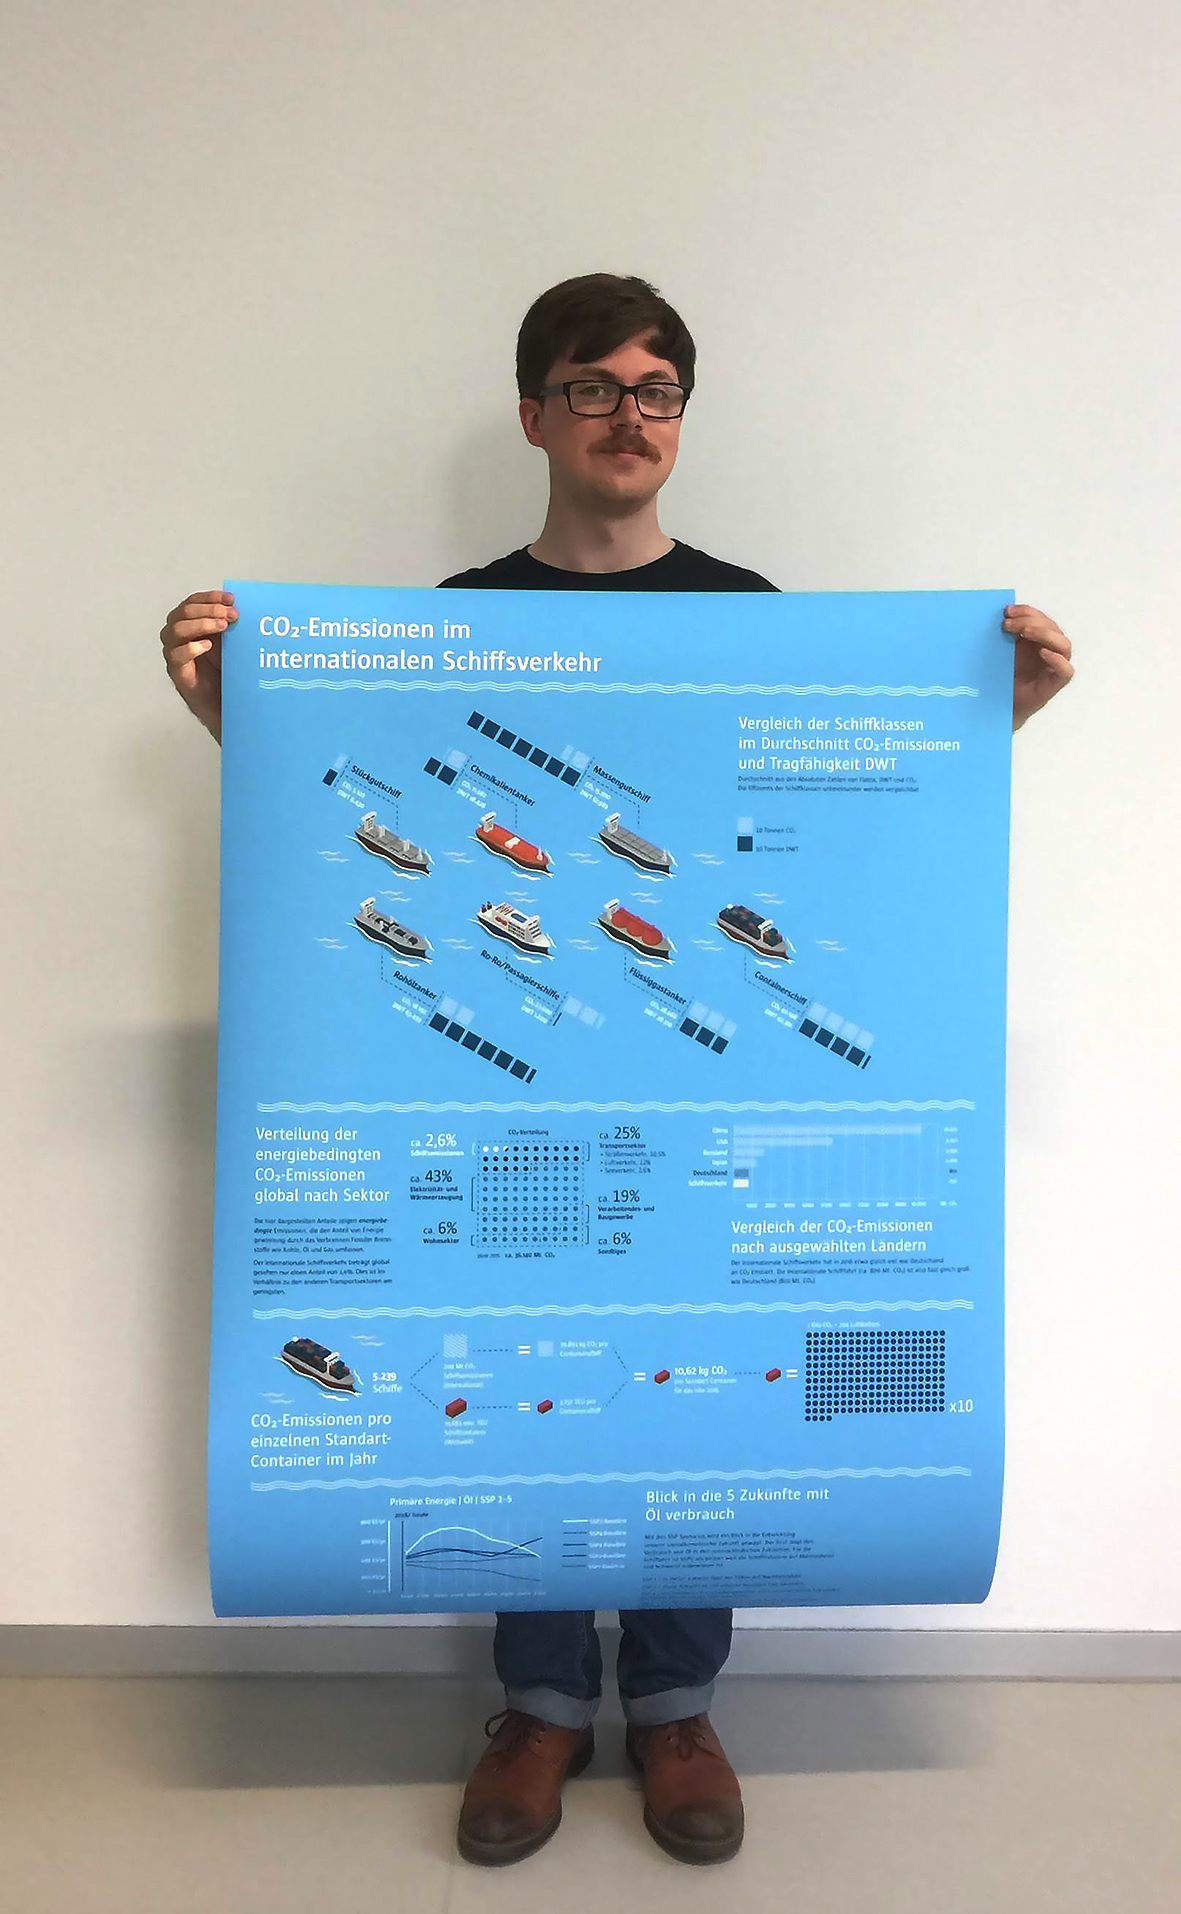
Final poster for our University of Applied Science Potsdam exhibition in 2019.

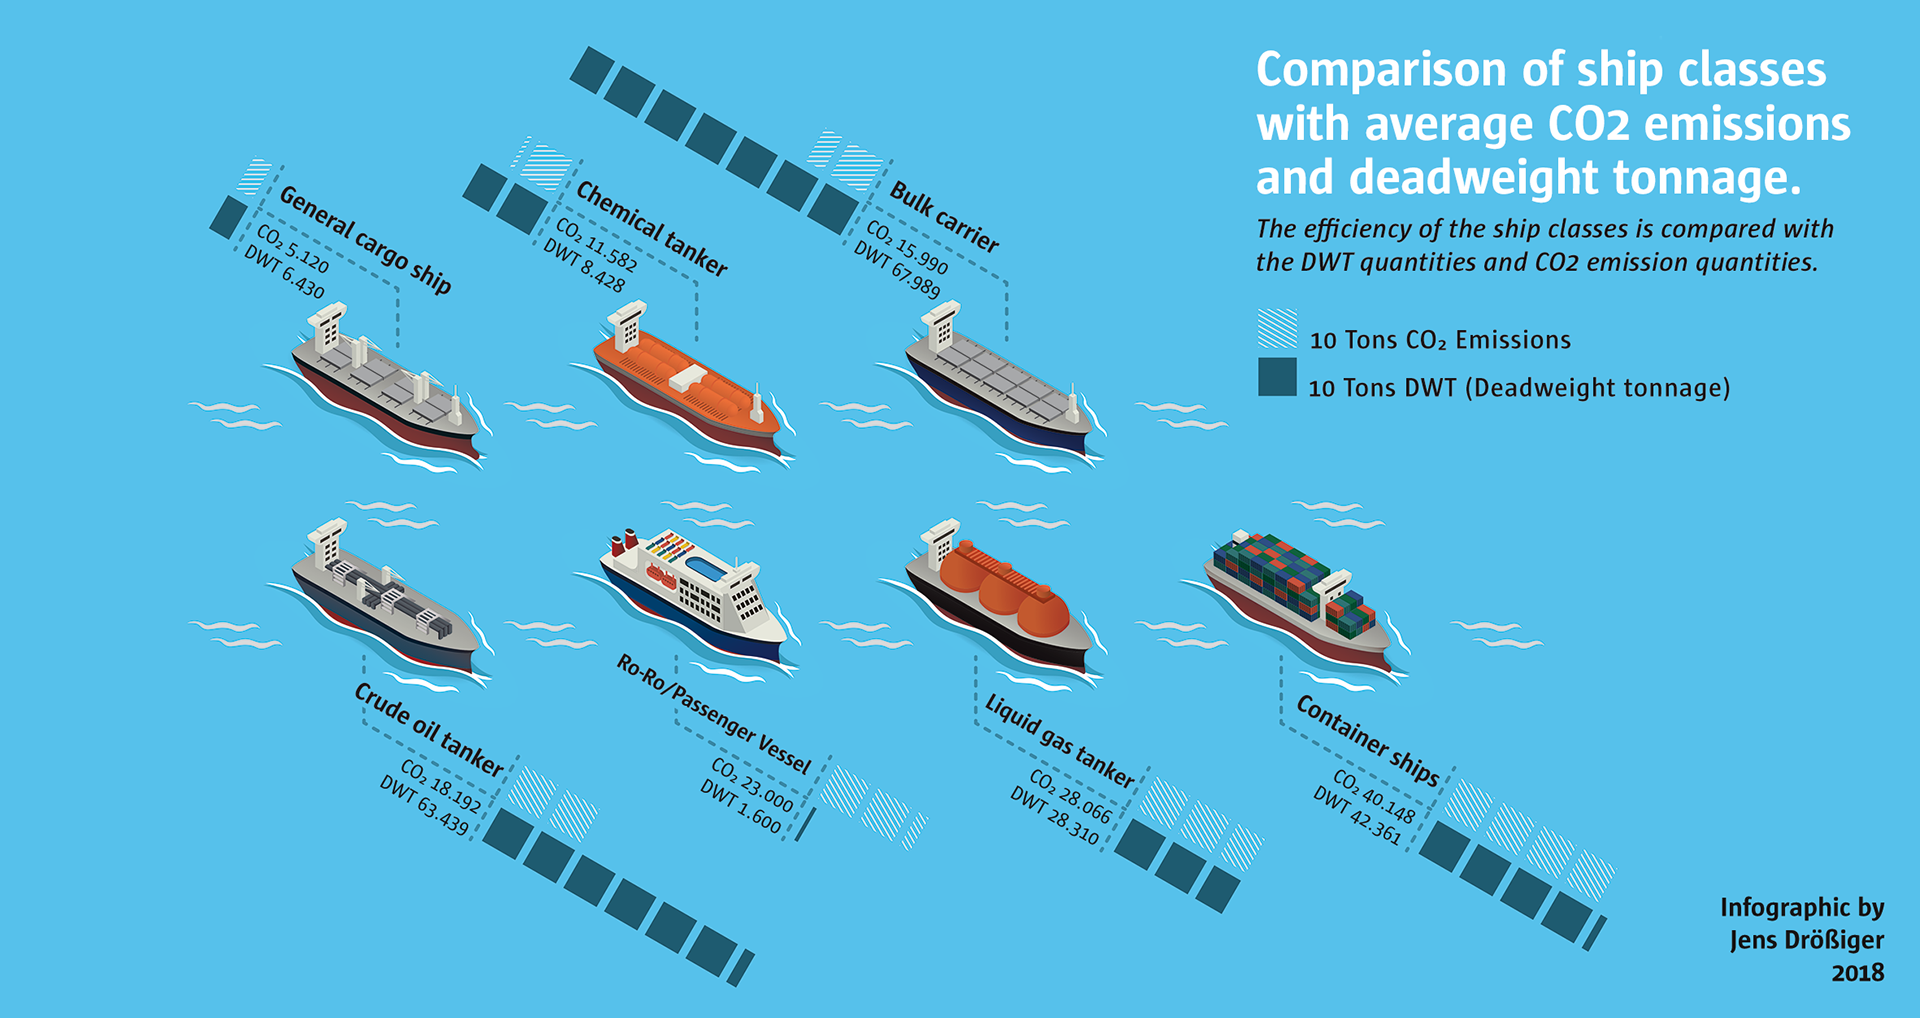
Here you see my final infographic of all cargo ships with CO2 emissions and dwt tons. My visualisation is based on the official IMO collection studies for shipping emissions in 2015.
I would also have been interested in knowing how many emissions luxury yachts generate per DWT, but the IMO has not collected any data on this topic, and no data were available in my study year.
(DWT = Deadweight tonnage)


Credits
Illustration & Research: Jens Ove Drößiger
Project Supervisor: Prof. Boris Müller
Project Supervisor: Prof. Boris Müller