How to explain the Corona Virus
About
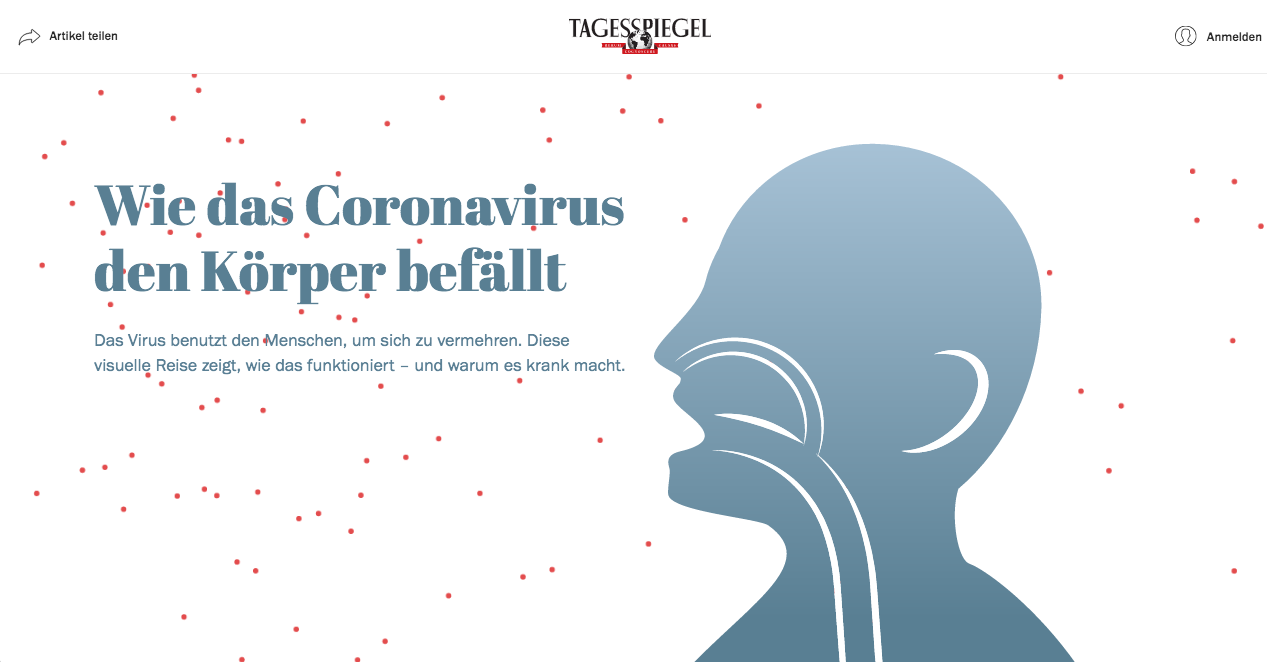
The article aimed to provide a simplified and easy-to-understand explanation of how the coronavirus affects our health and makes us sick. The goal was to explain the complex science behind the virus accessible to a broader audience and help readers better understand the nature of this infectious disease.
This infographic project was developed during my summer internship in 2020 (during the pandemic) for the Berlin newspaper „Der Tagesspiegel“.
My responsibilities involved:
• a lot of reading and fact-finding
• make small graphics and icons in Adobe Illustrator
• doing Photoshop edits for social Media articles and interactive explainers
Challenges in this project were:
1. I started my internship in April 2020 during the coronavirus lockdown, so I had to work remotely. It wasn't easy to meet the Tagesspiegel Innovation Lab team and understand their work processes in my remote work.
2. We had a deadline of three weeks
3. Due to the rapid progress in virus research, We had to make daily updates to our infographic.
2. We had a deadline of three weeks
3. Due to the rapid progress in virus research, We had to make daily updates to our infographic.
Storyboard
I chose scrolly-telling to showcase the coronavirus process, allowing readers to learn about the virus in a visually engaging way. I worked with Helena Wittlich from the Innovation Lab to collect and organize scientific information, which was turned into a comprehensive storyboard for the presentation.
It was a daily exchange of creating, drawing and presenting until we had the story structure.
In collaboration with Helena Wittlich, we conducted an in-depth research investigation to gain a comprehensive understanding of the virus and its DNA reproduction process in human cells.
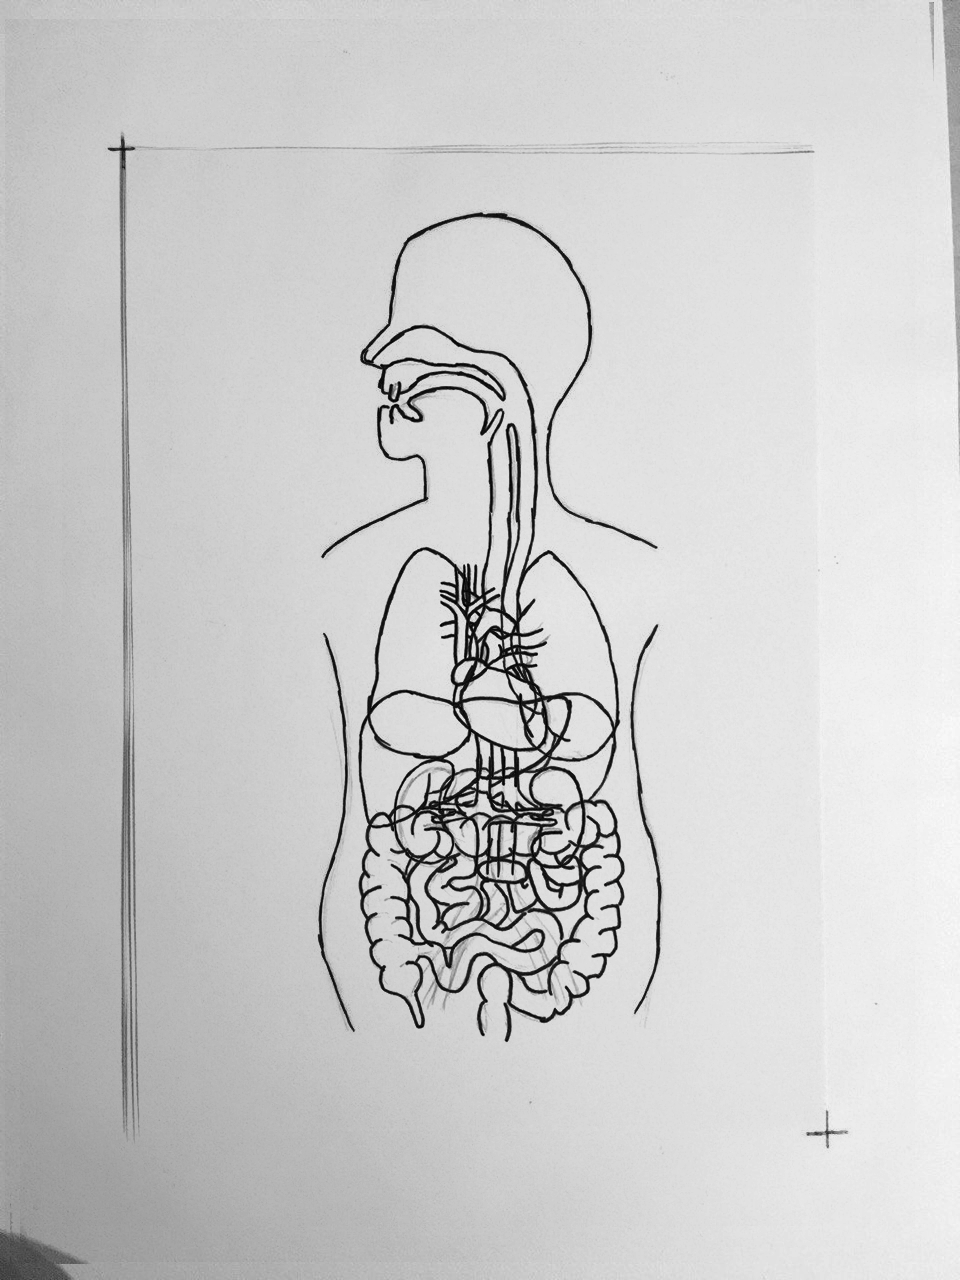
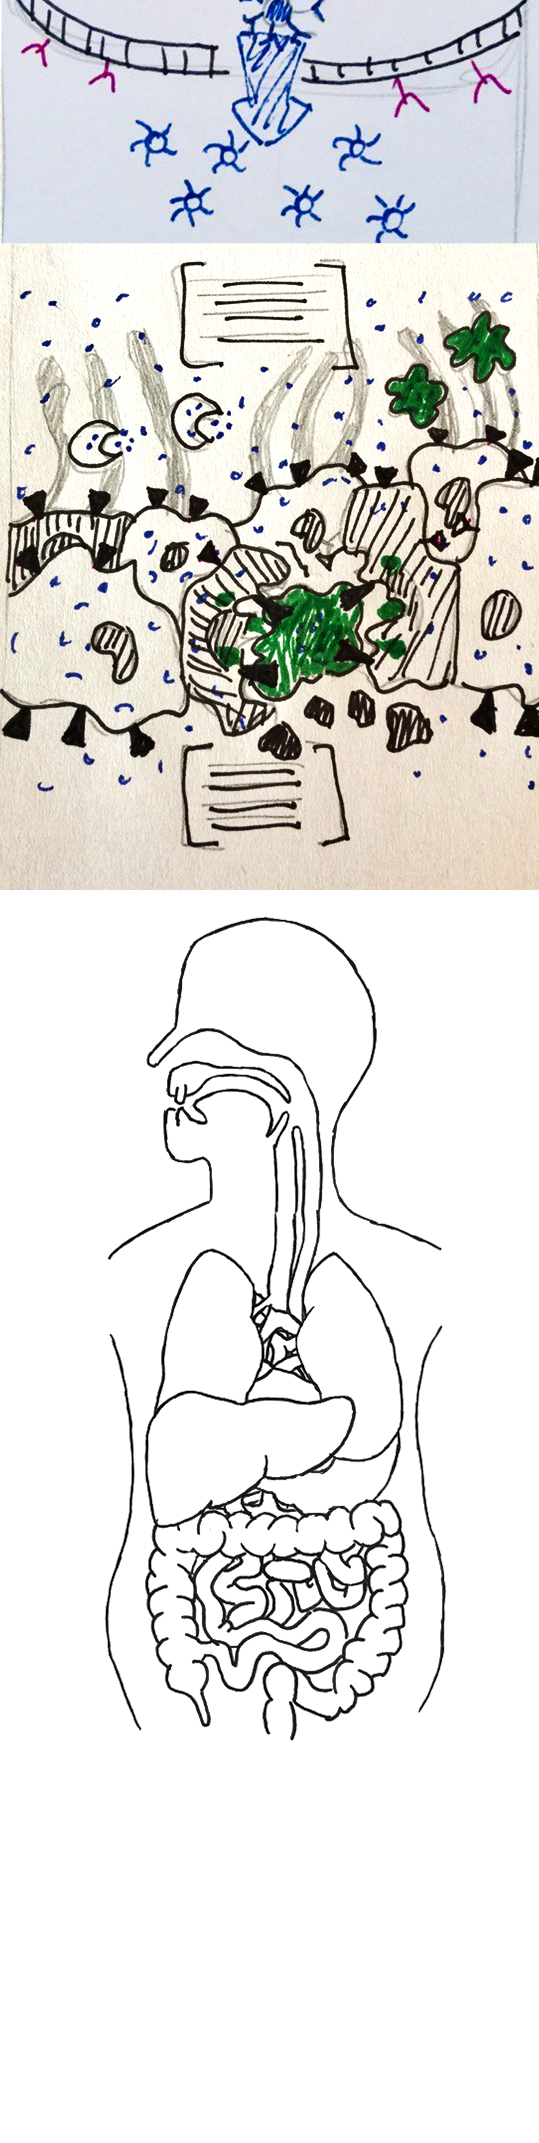
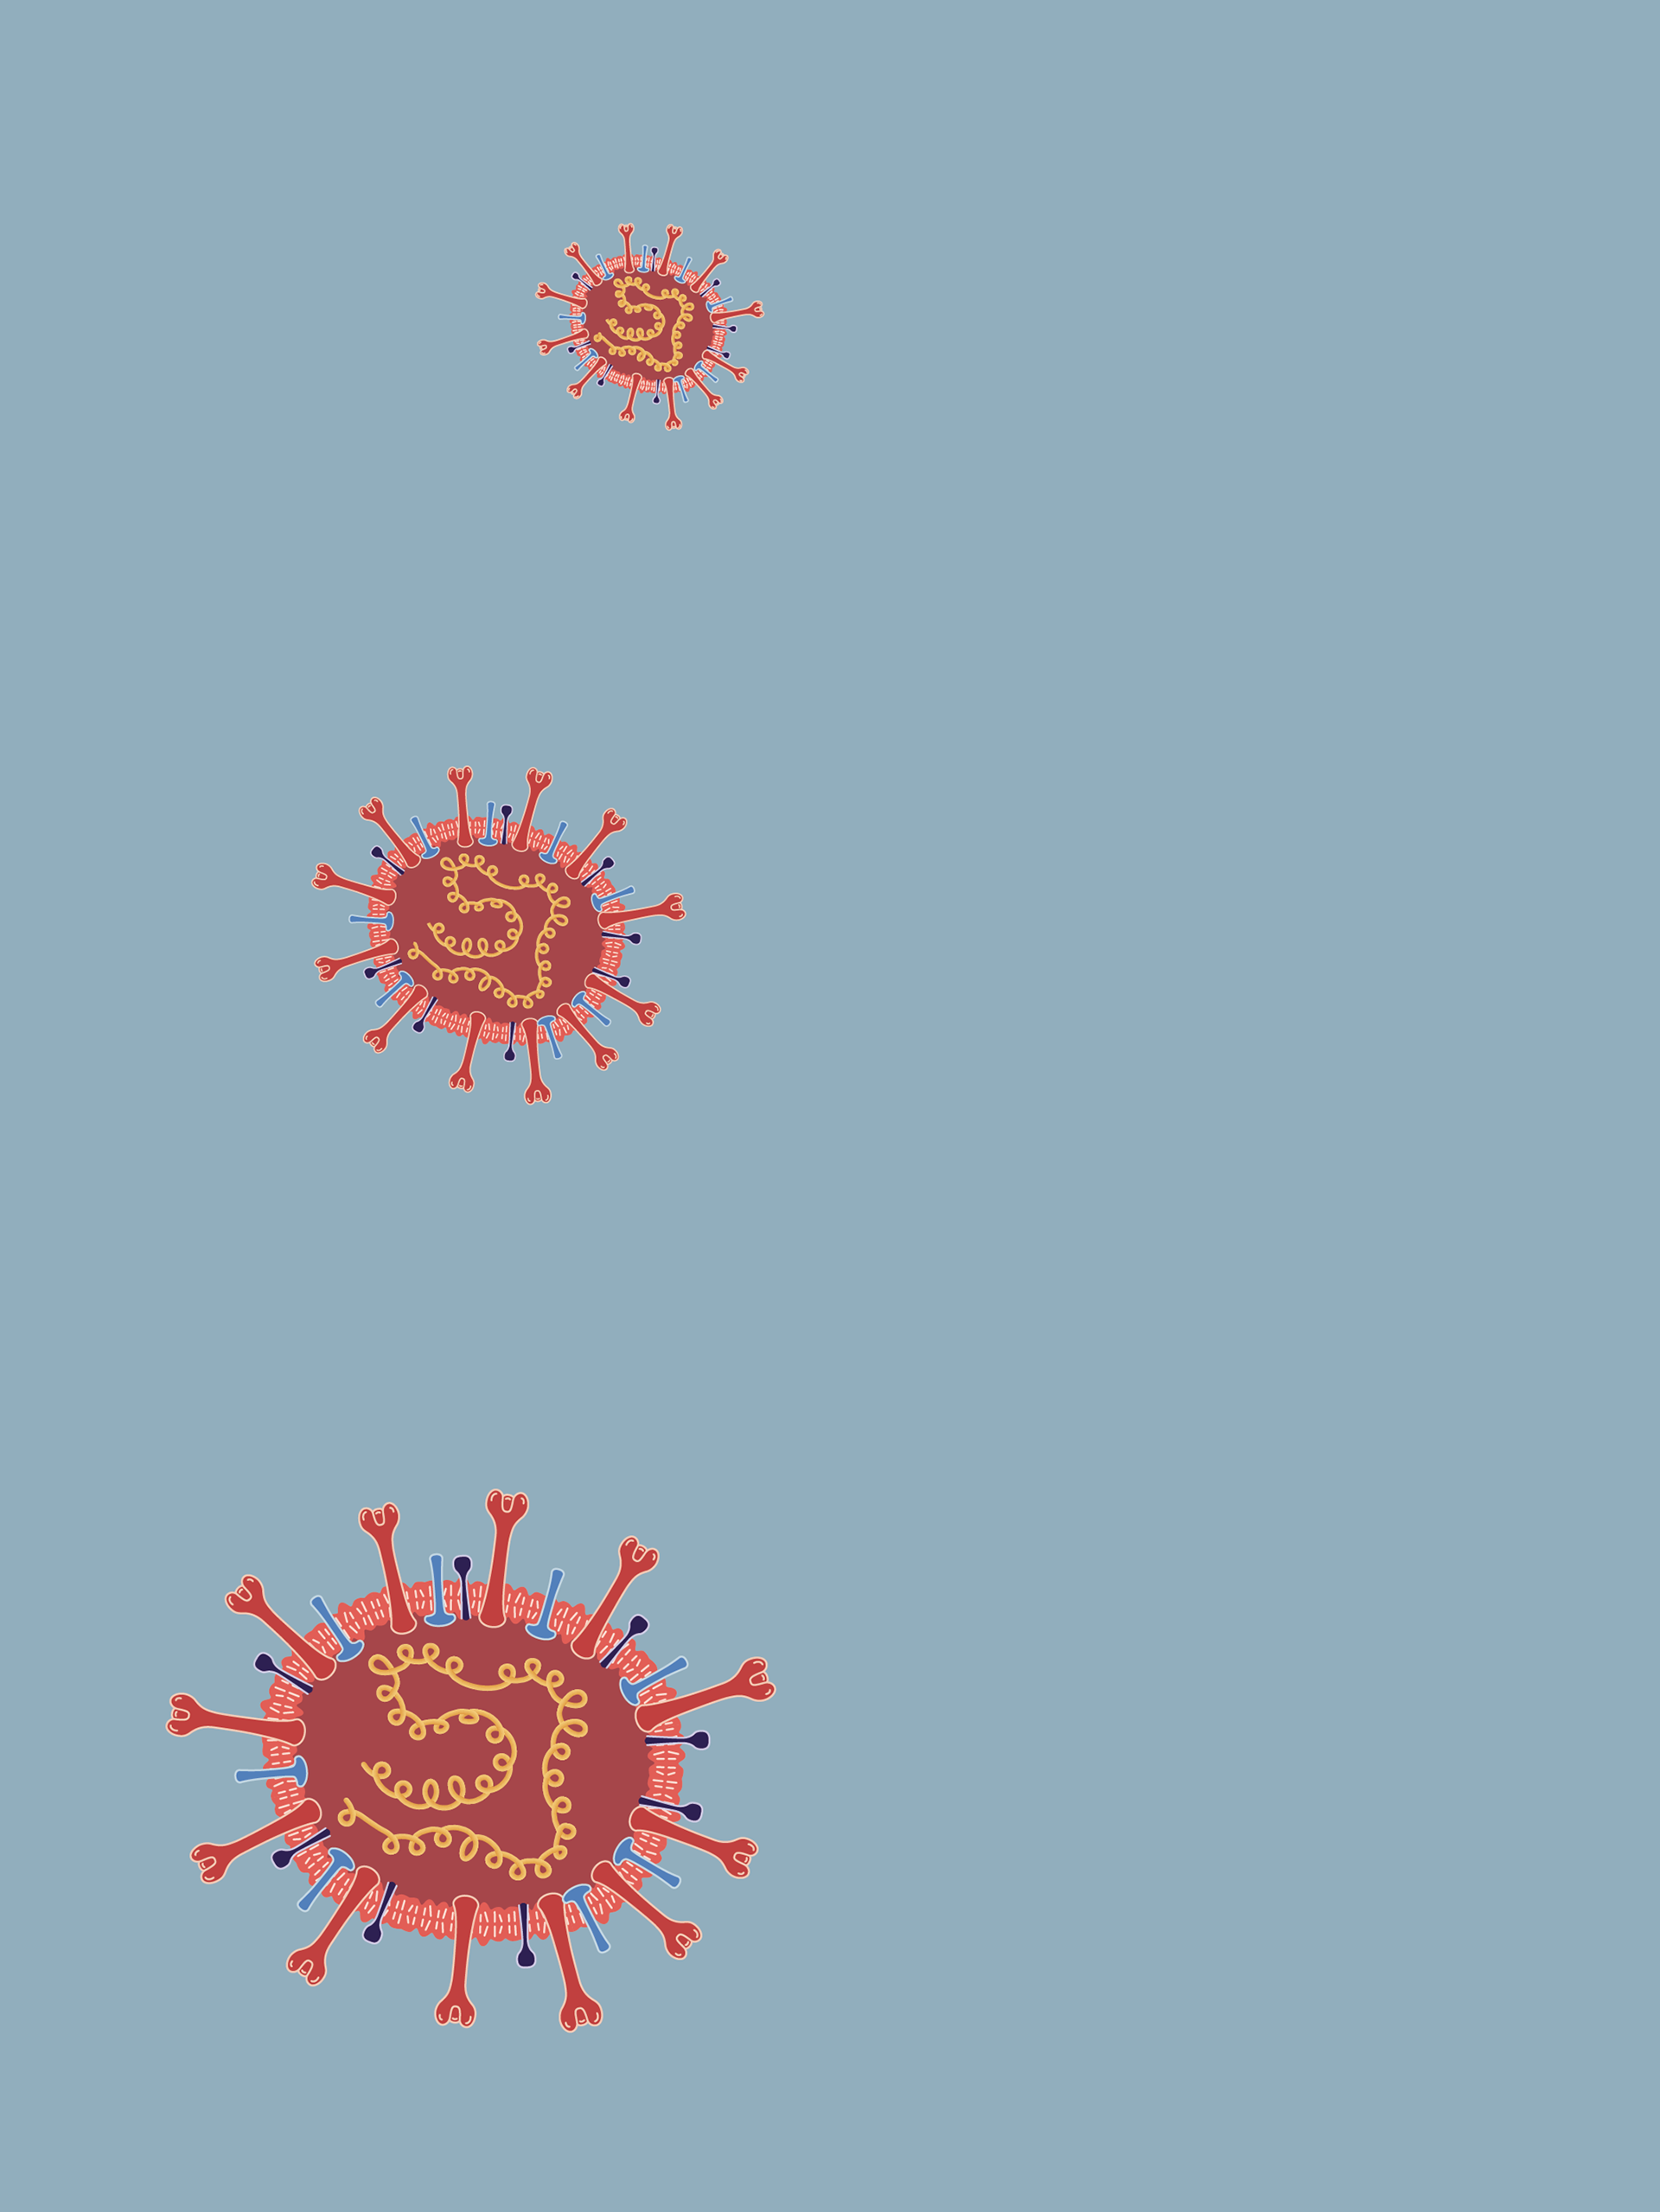
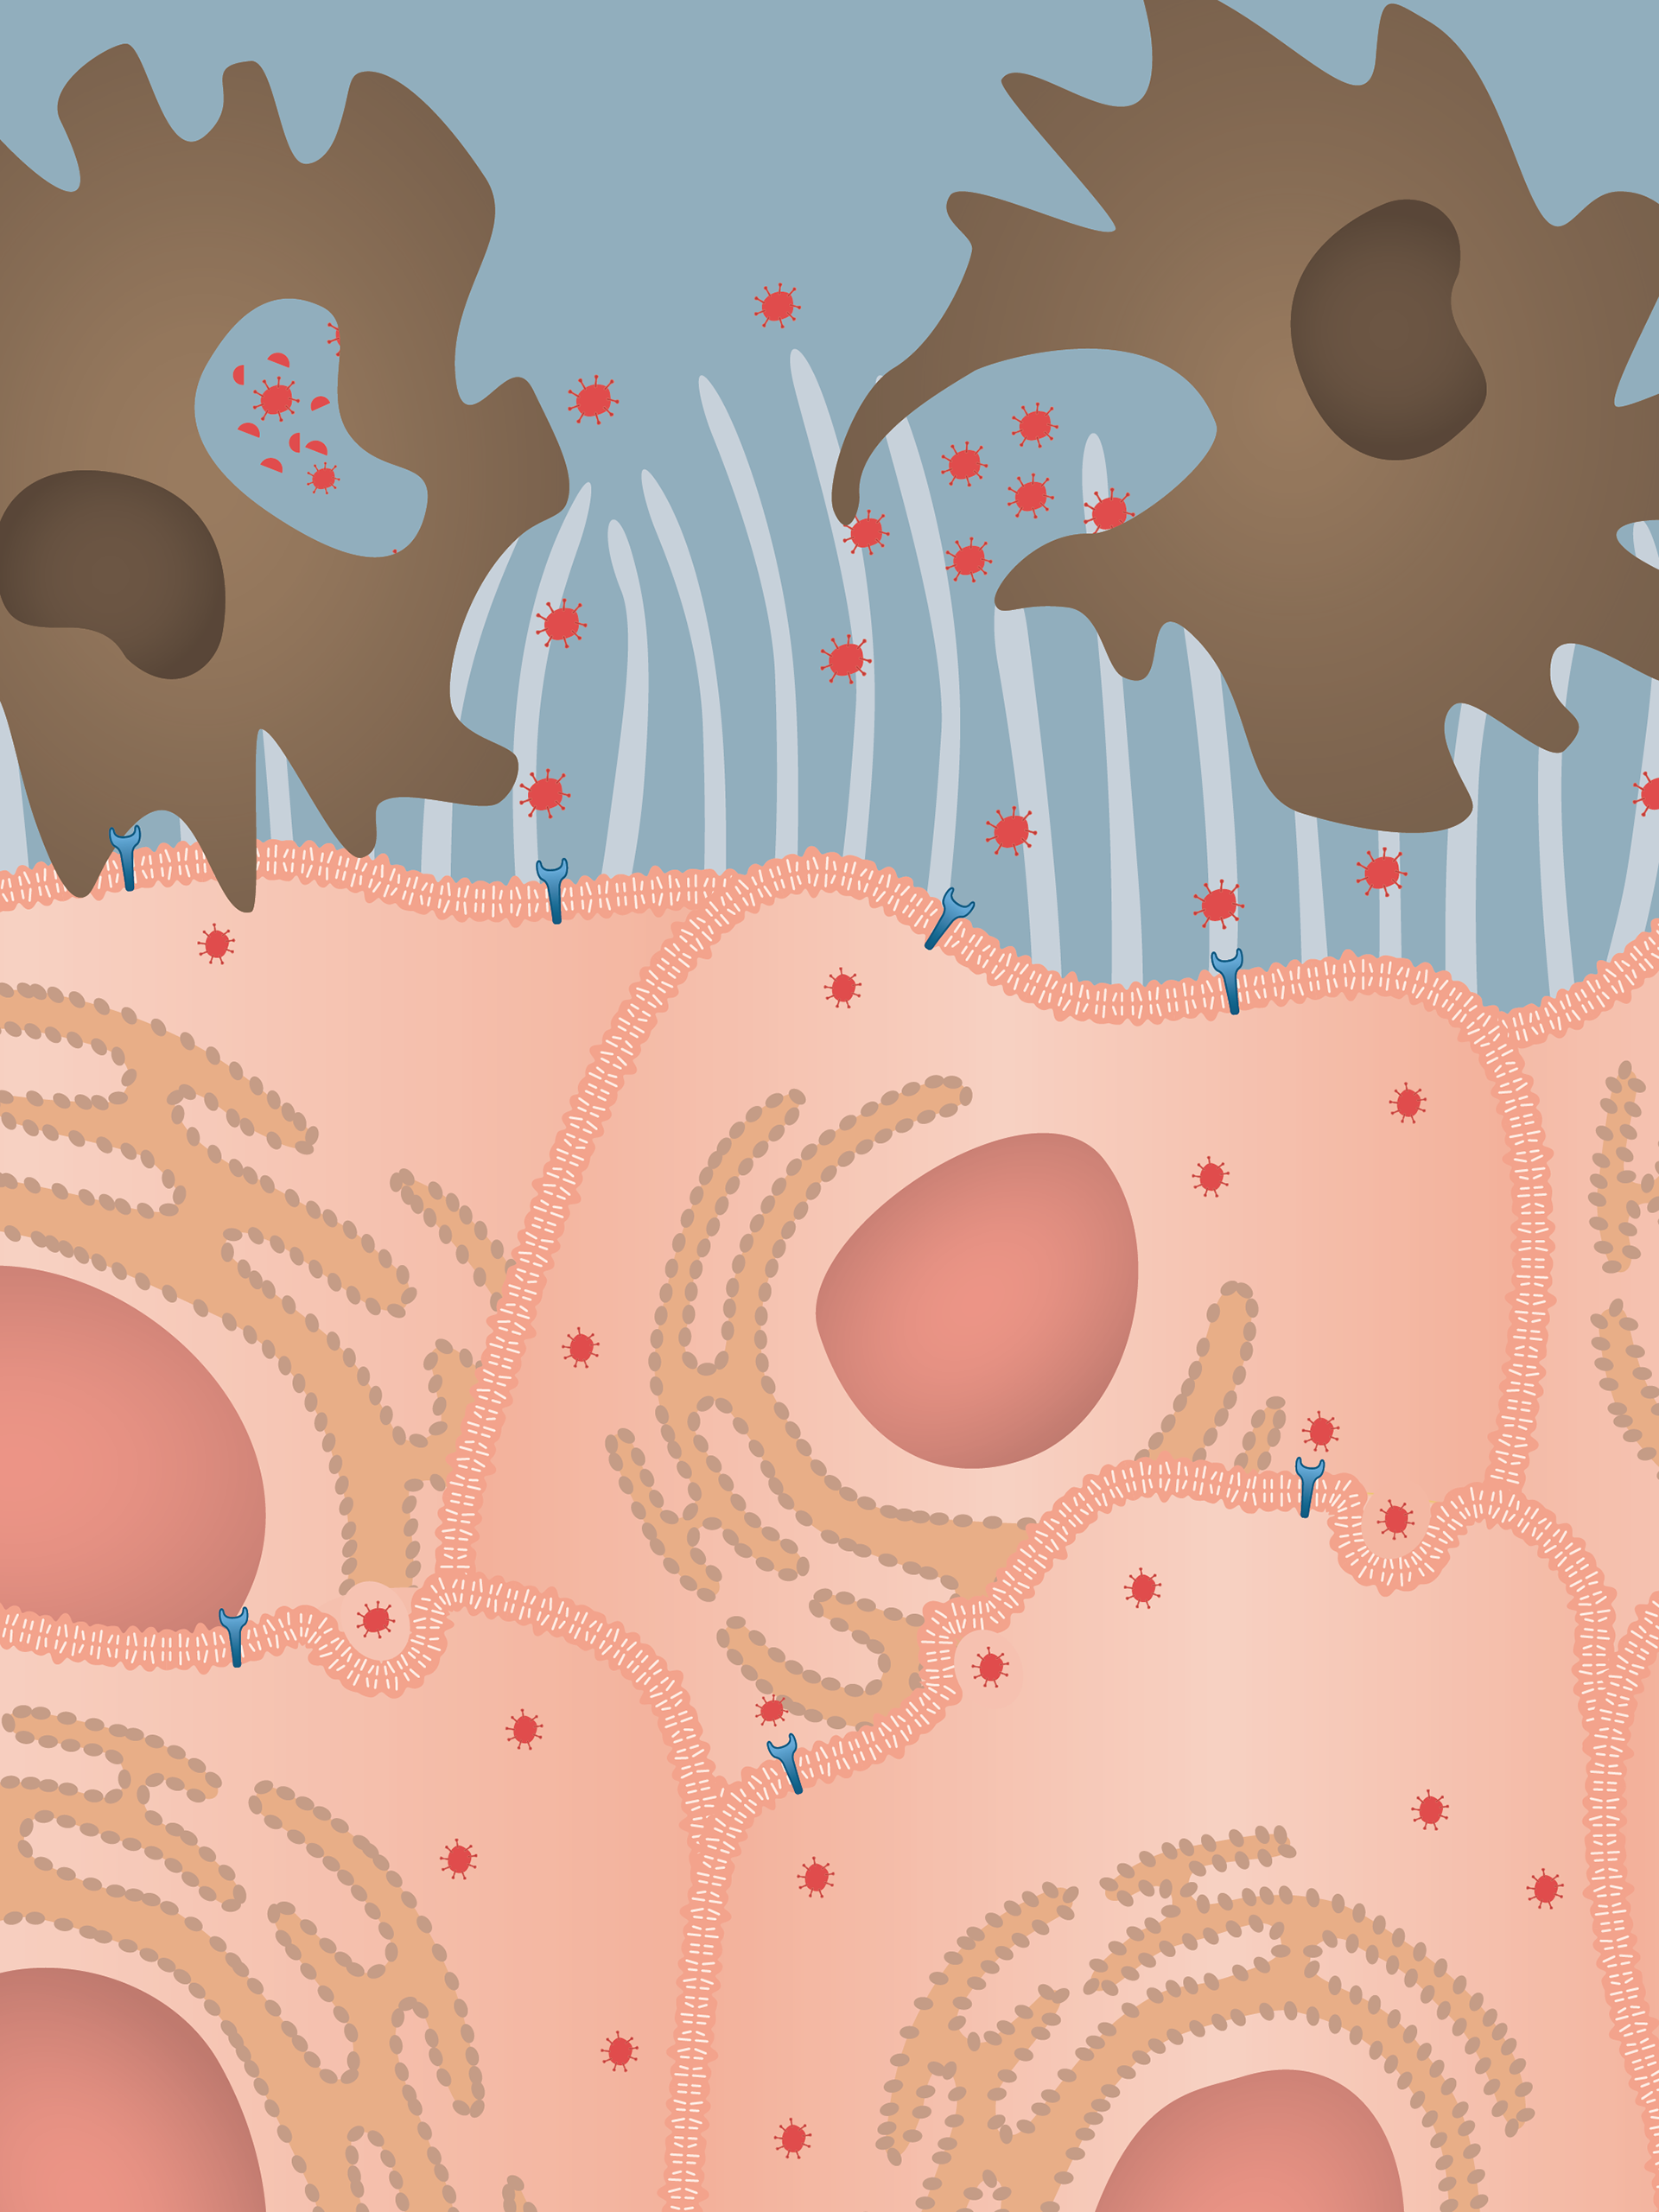
view inside the human body. Hand drawn by me.
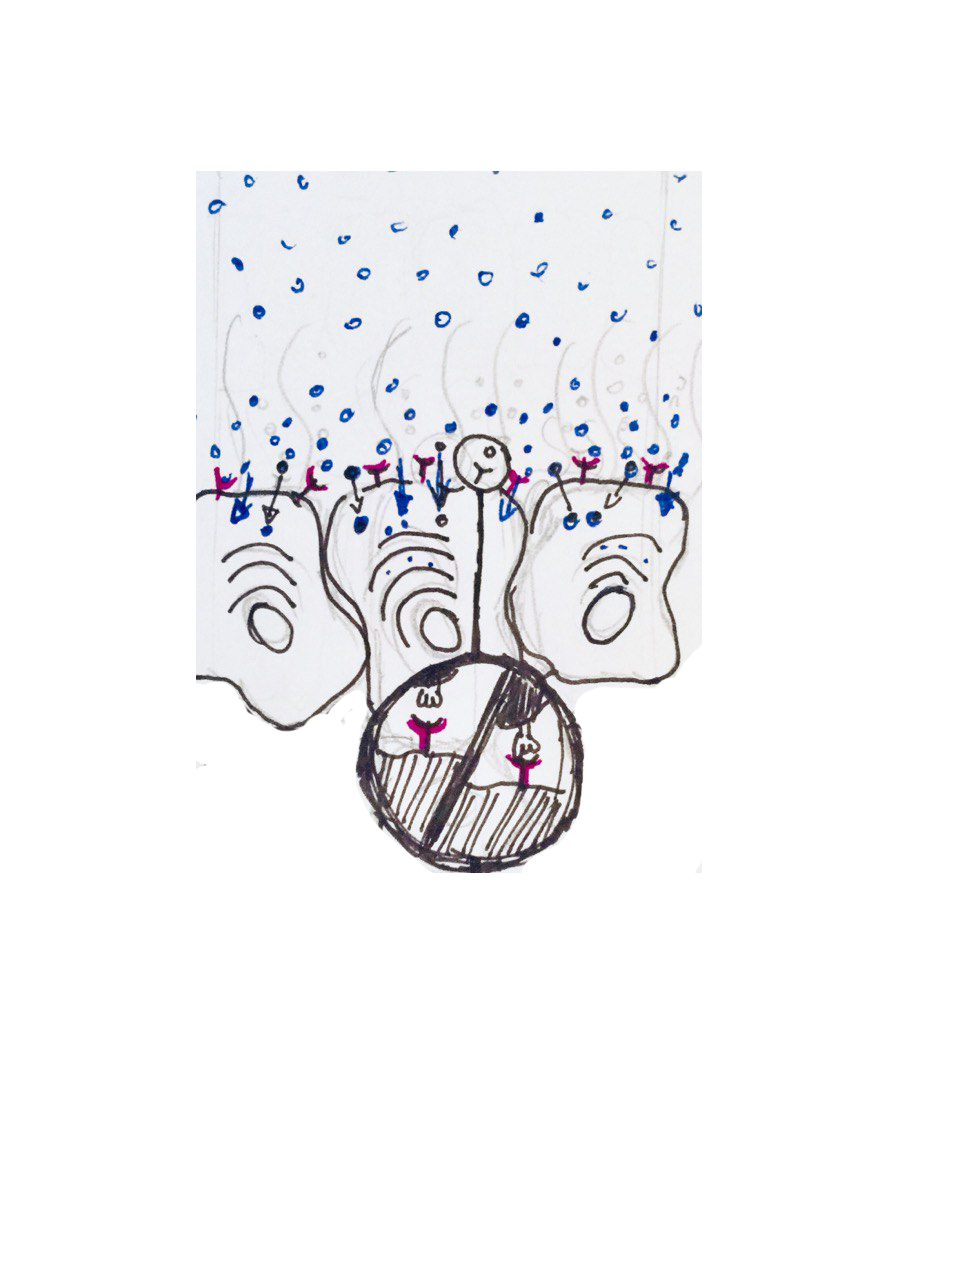
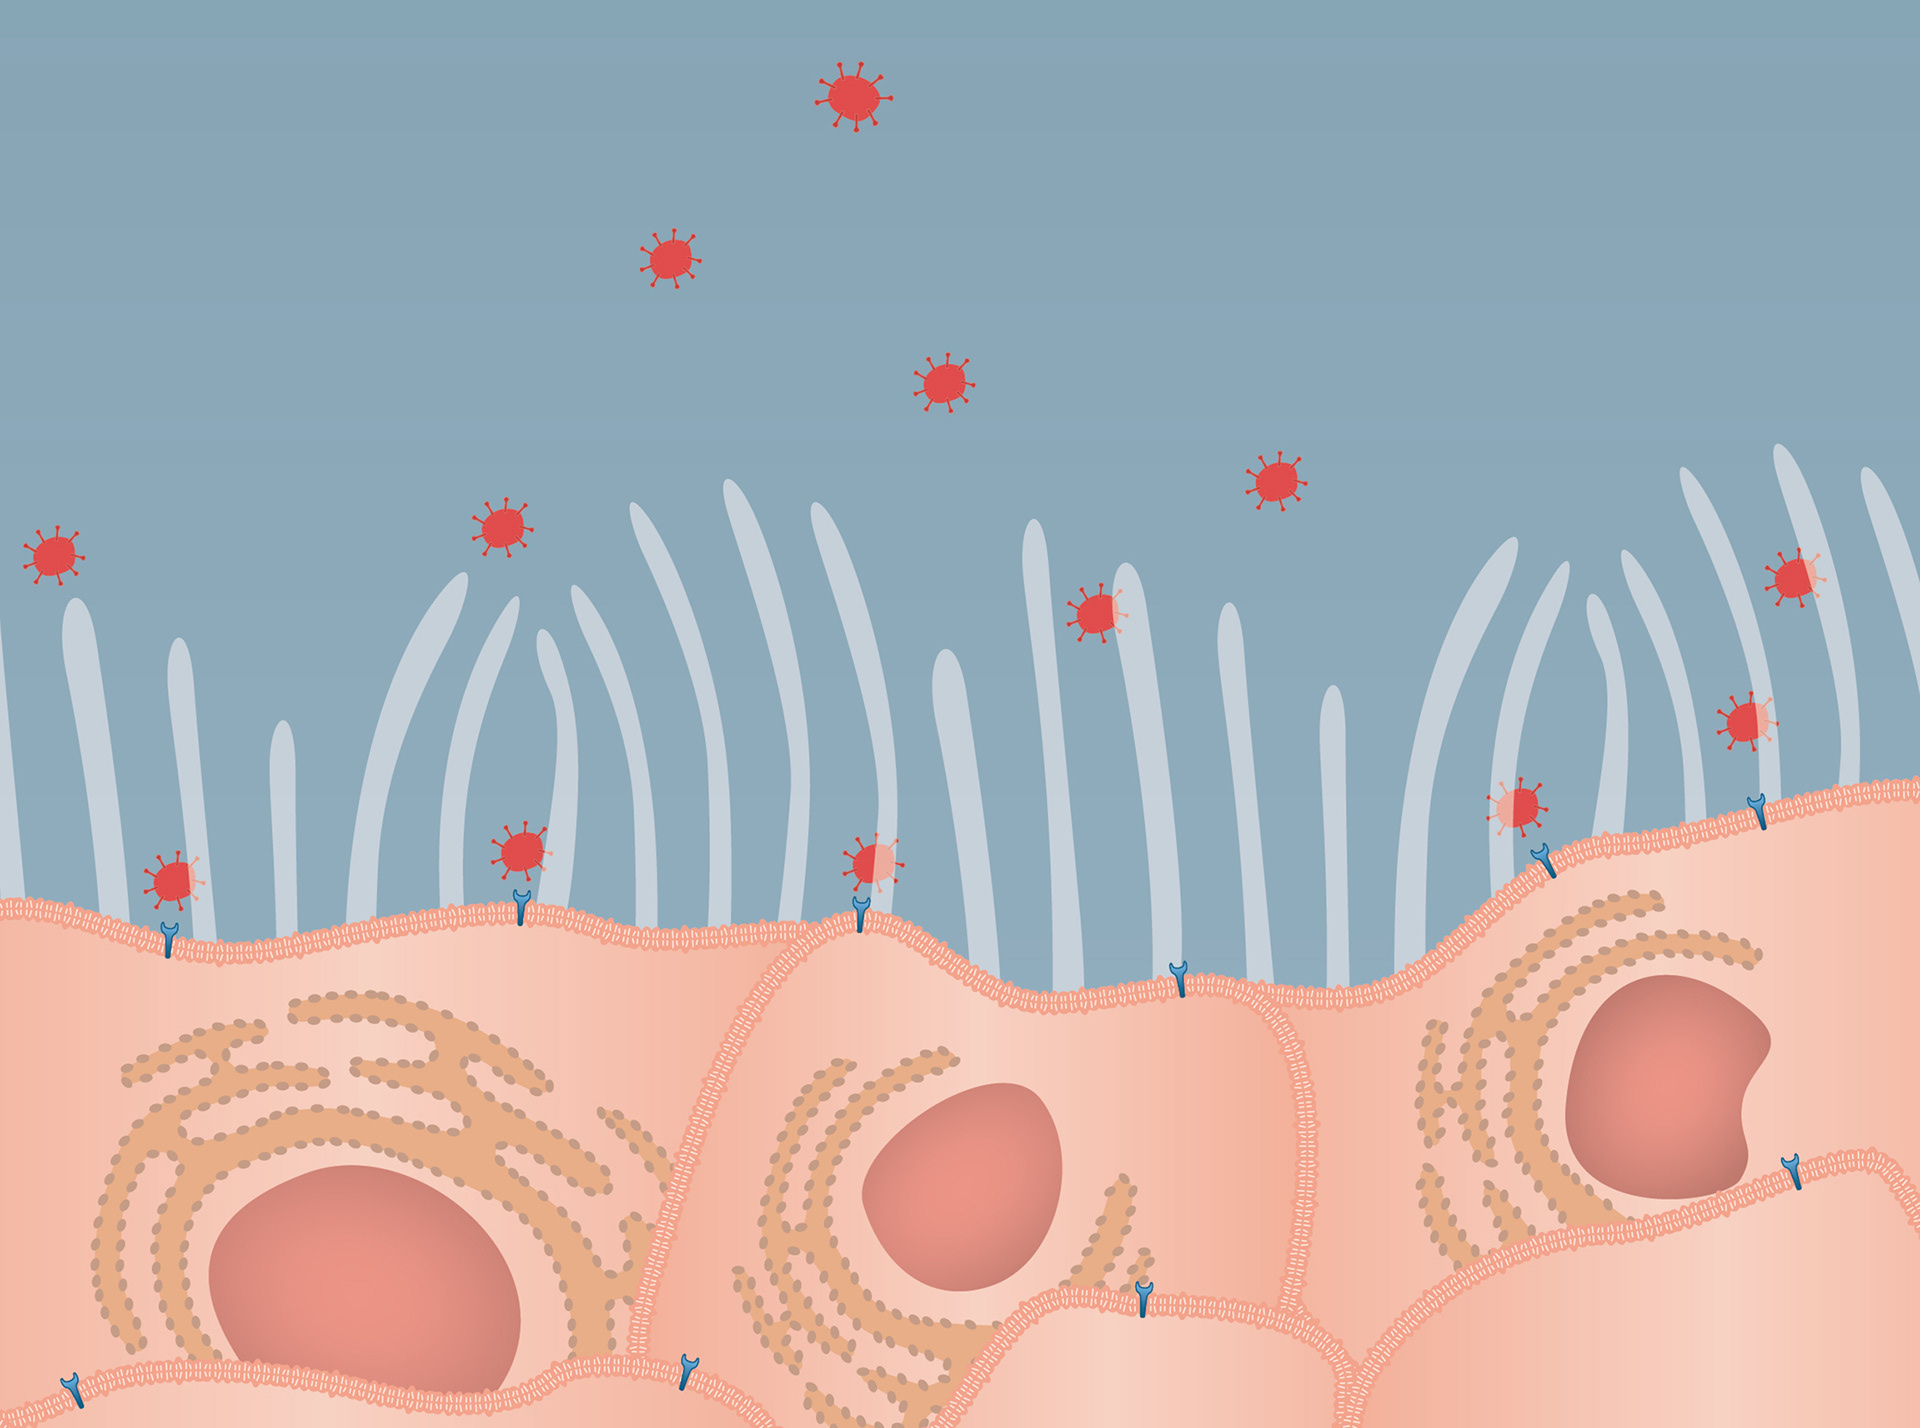
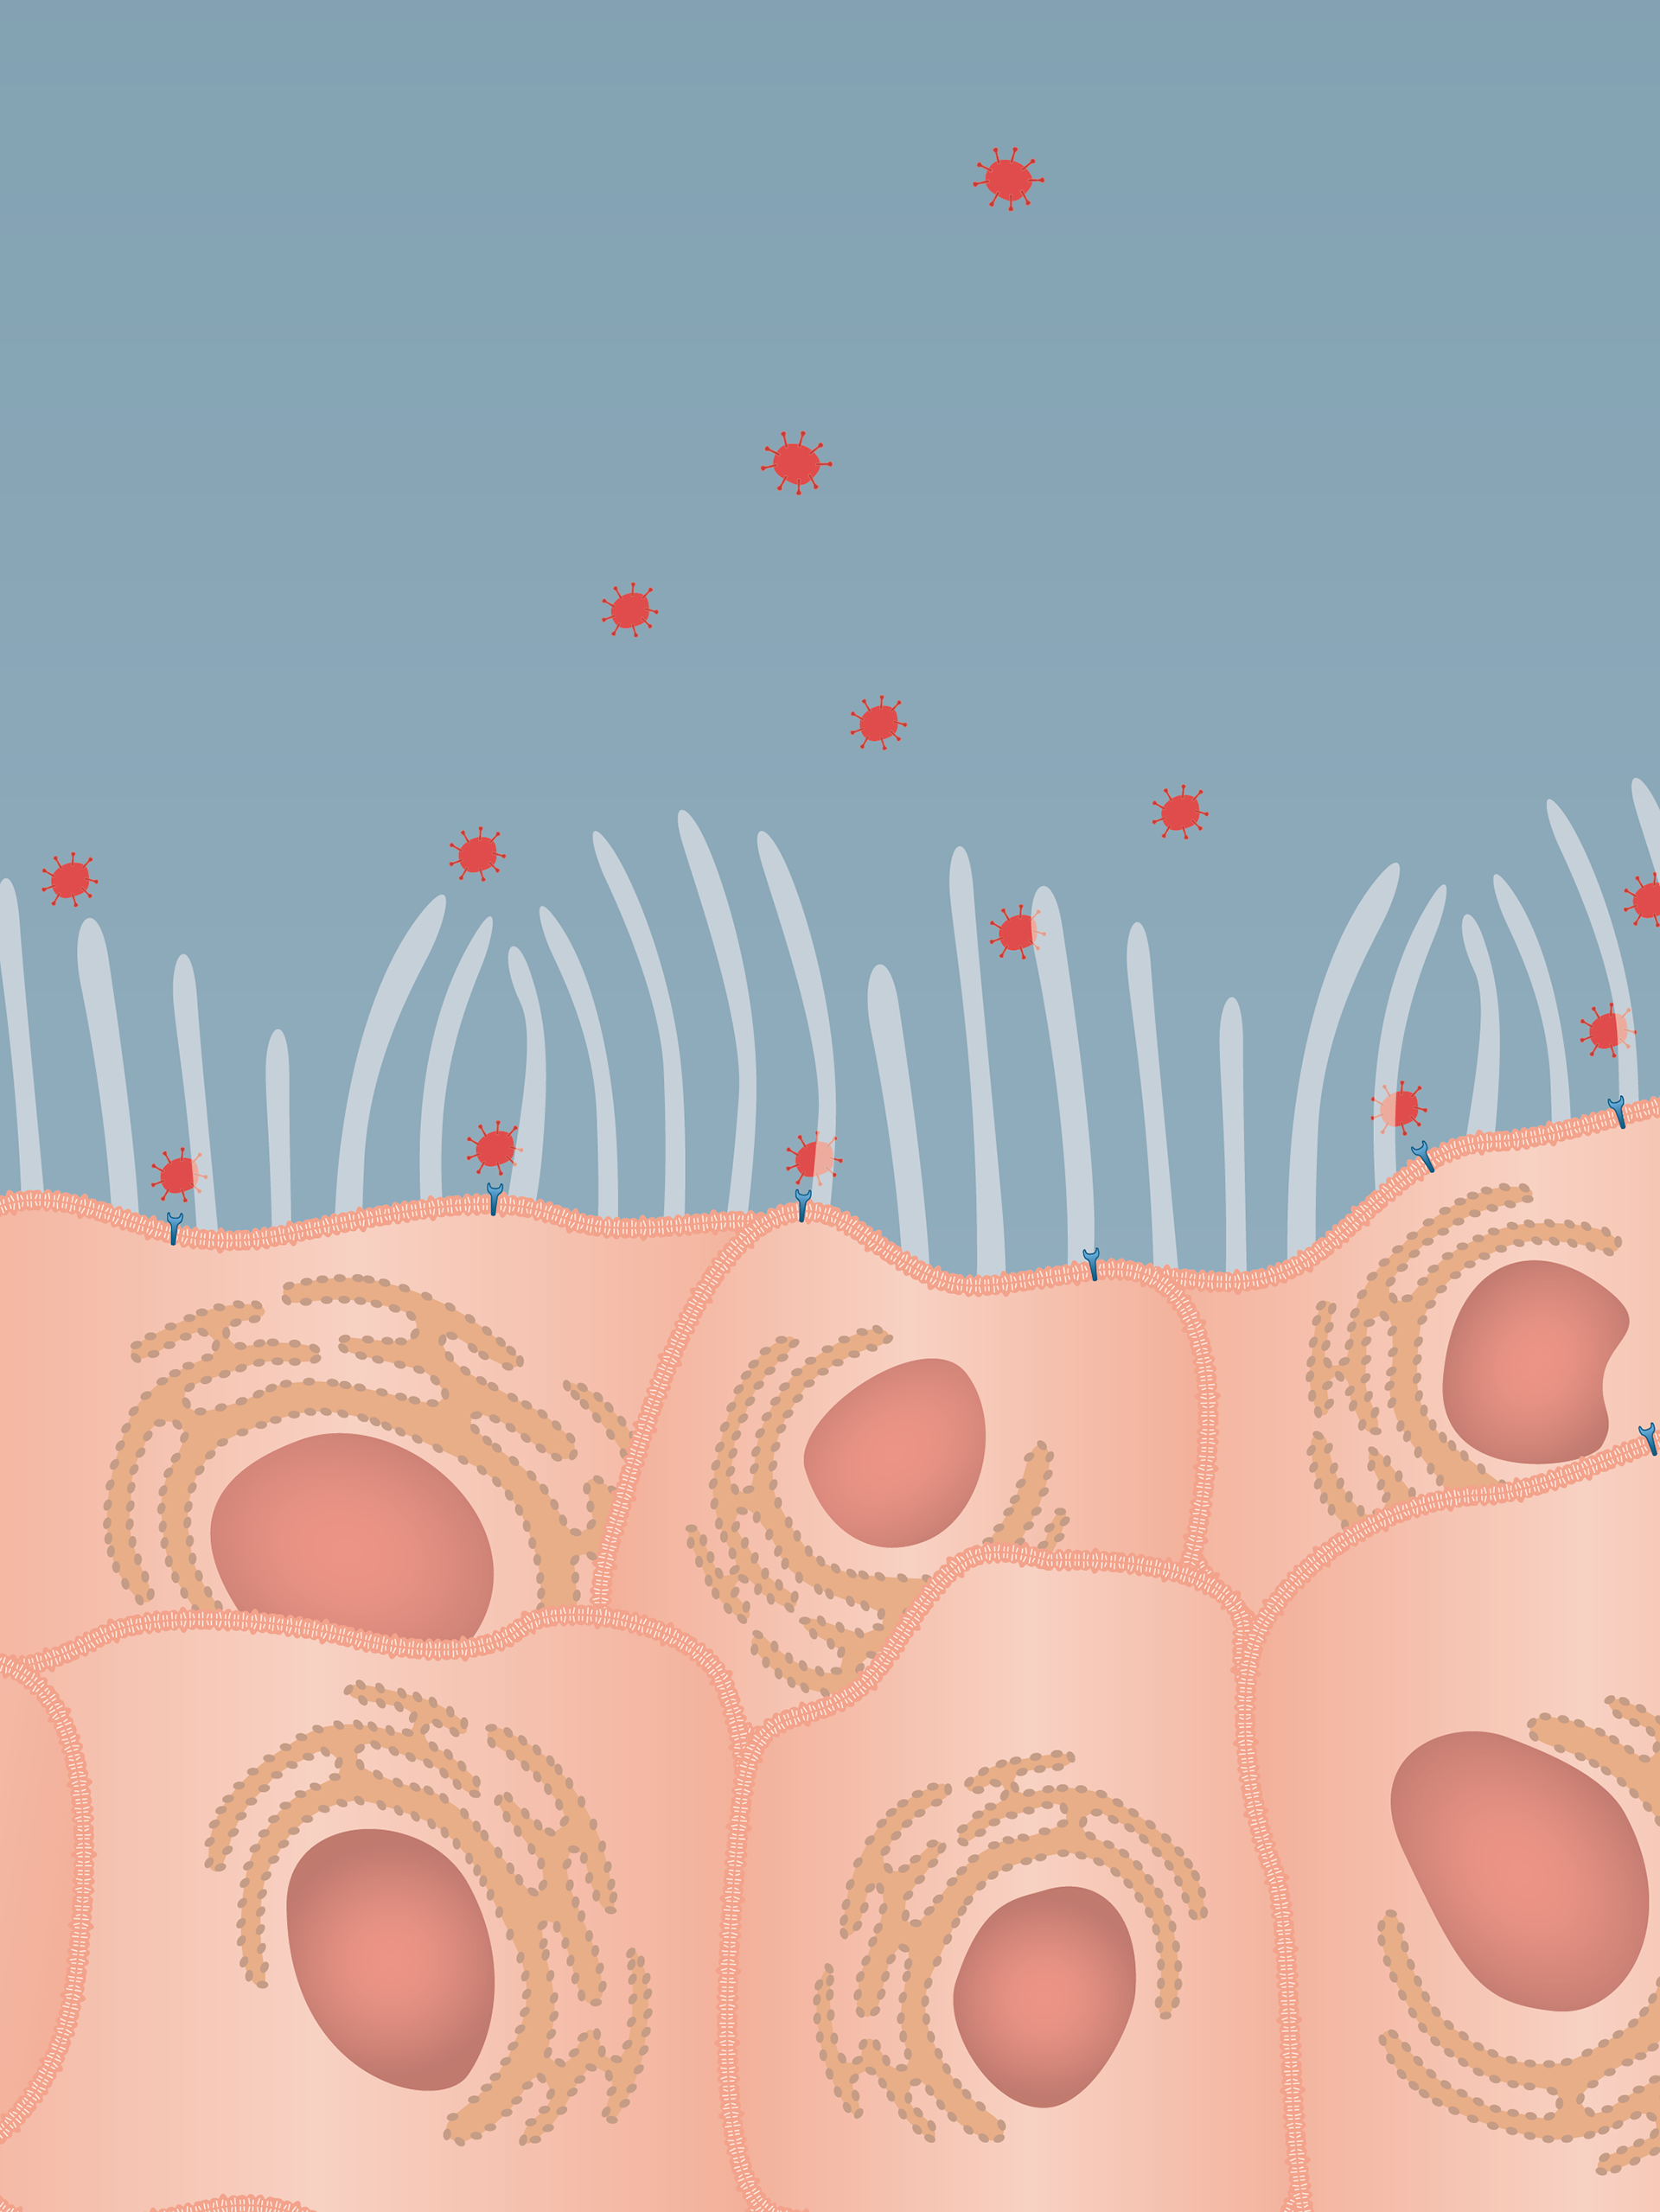
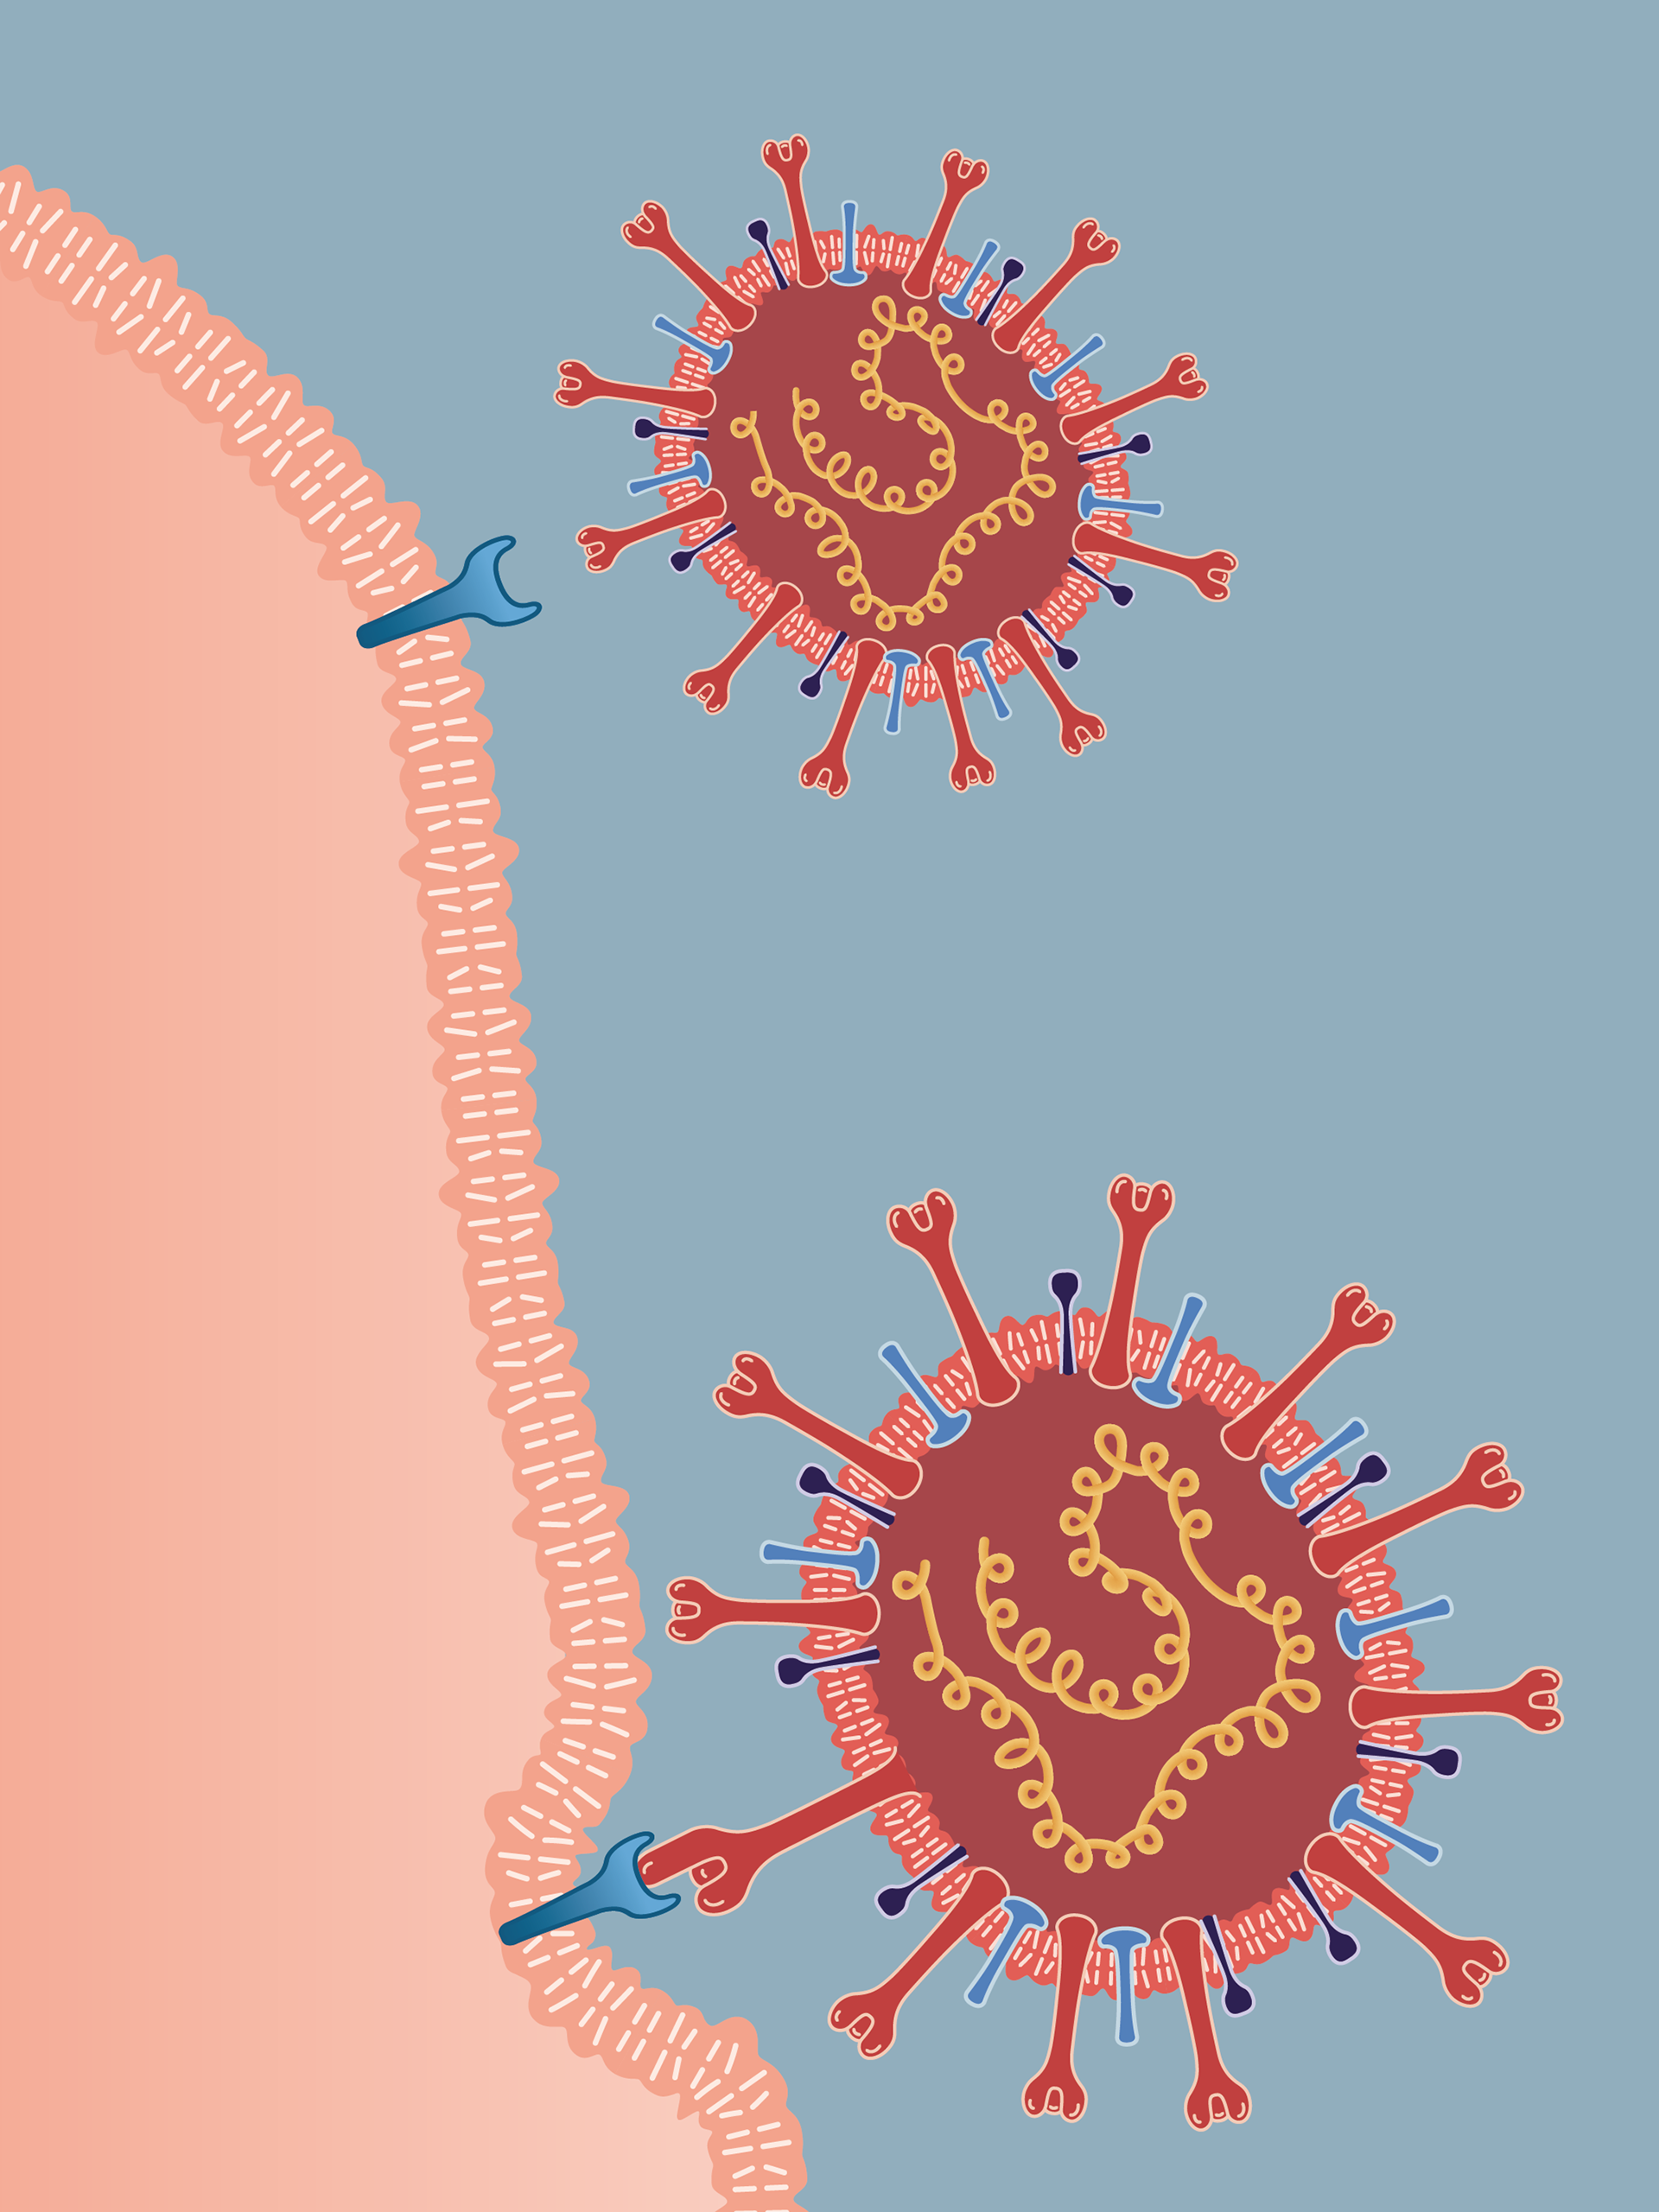
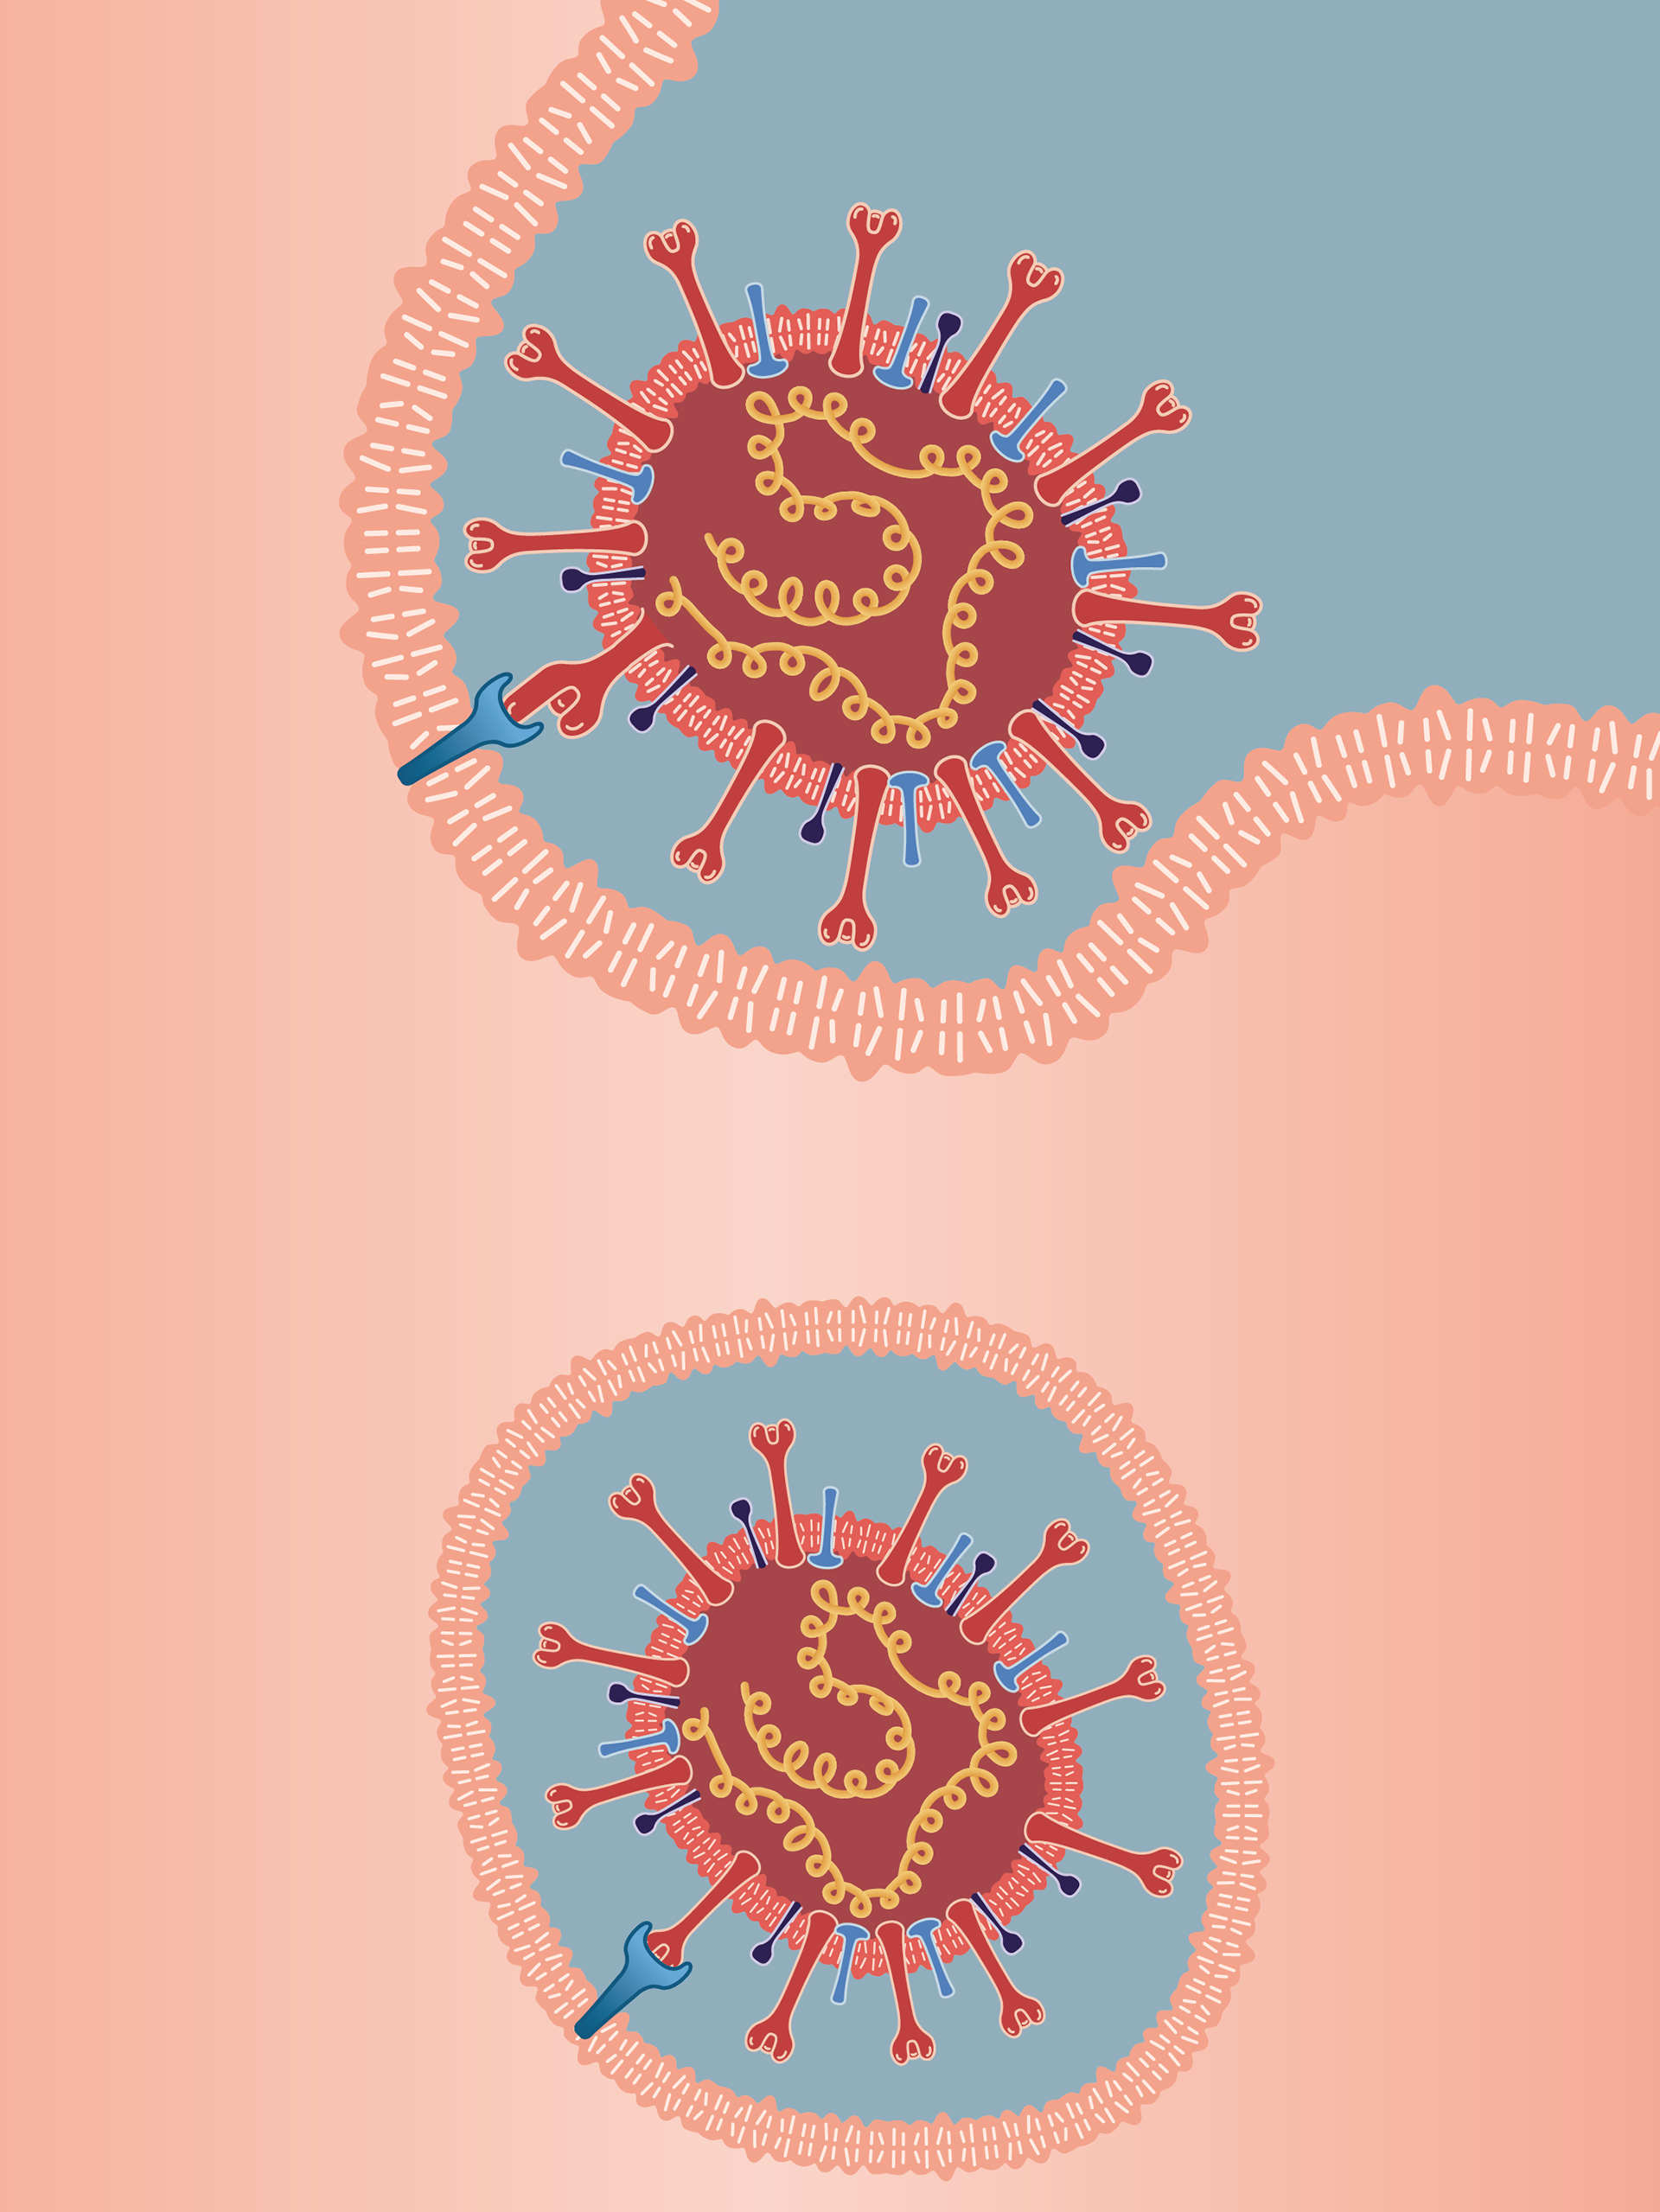
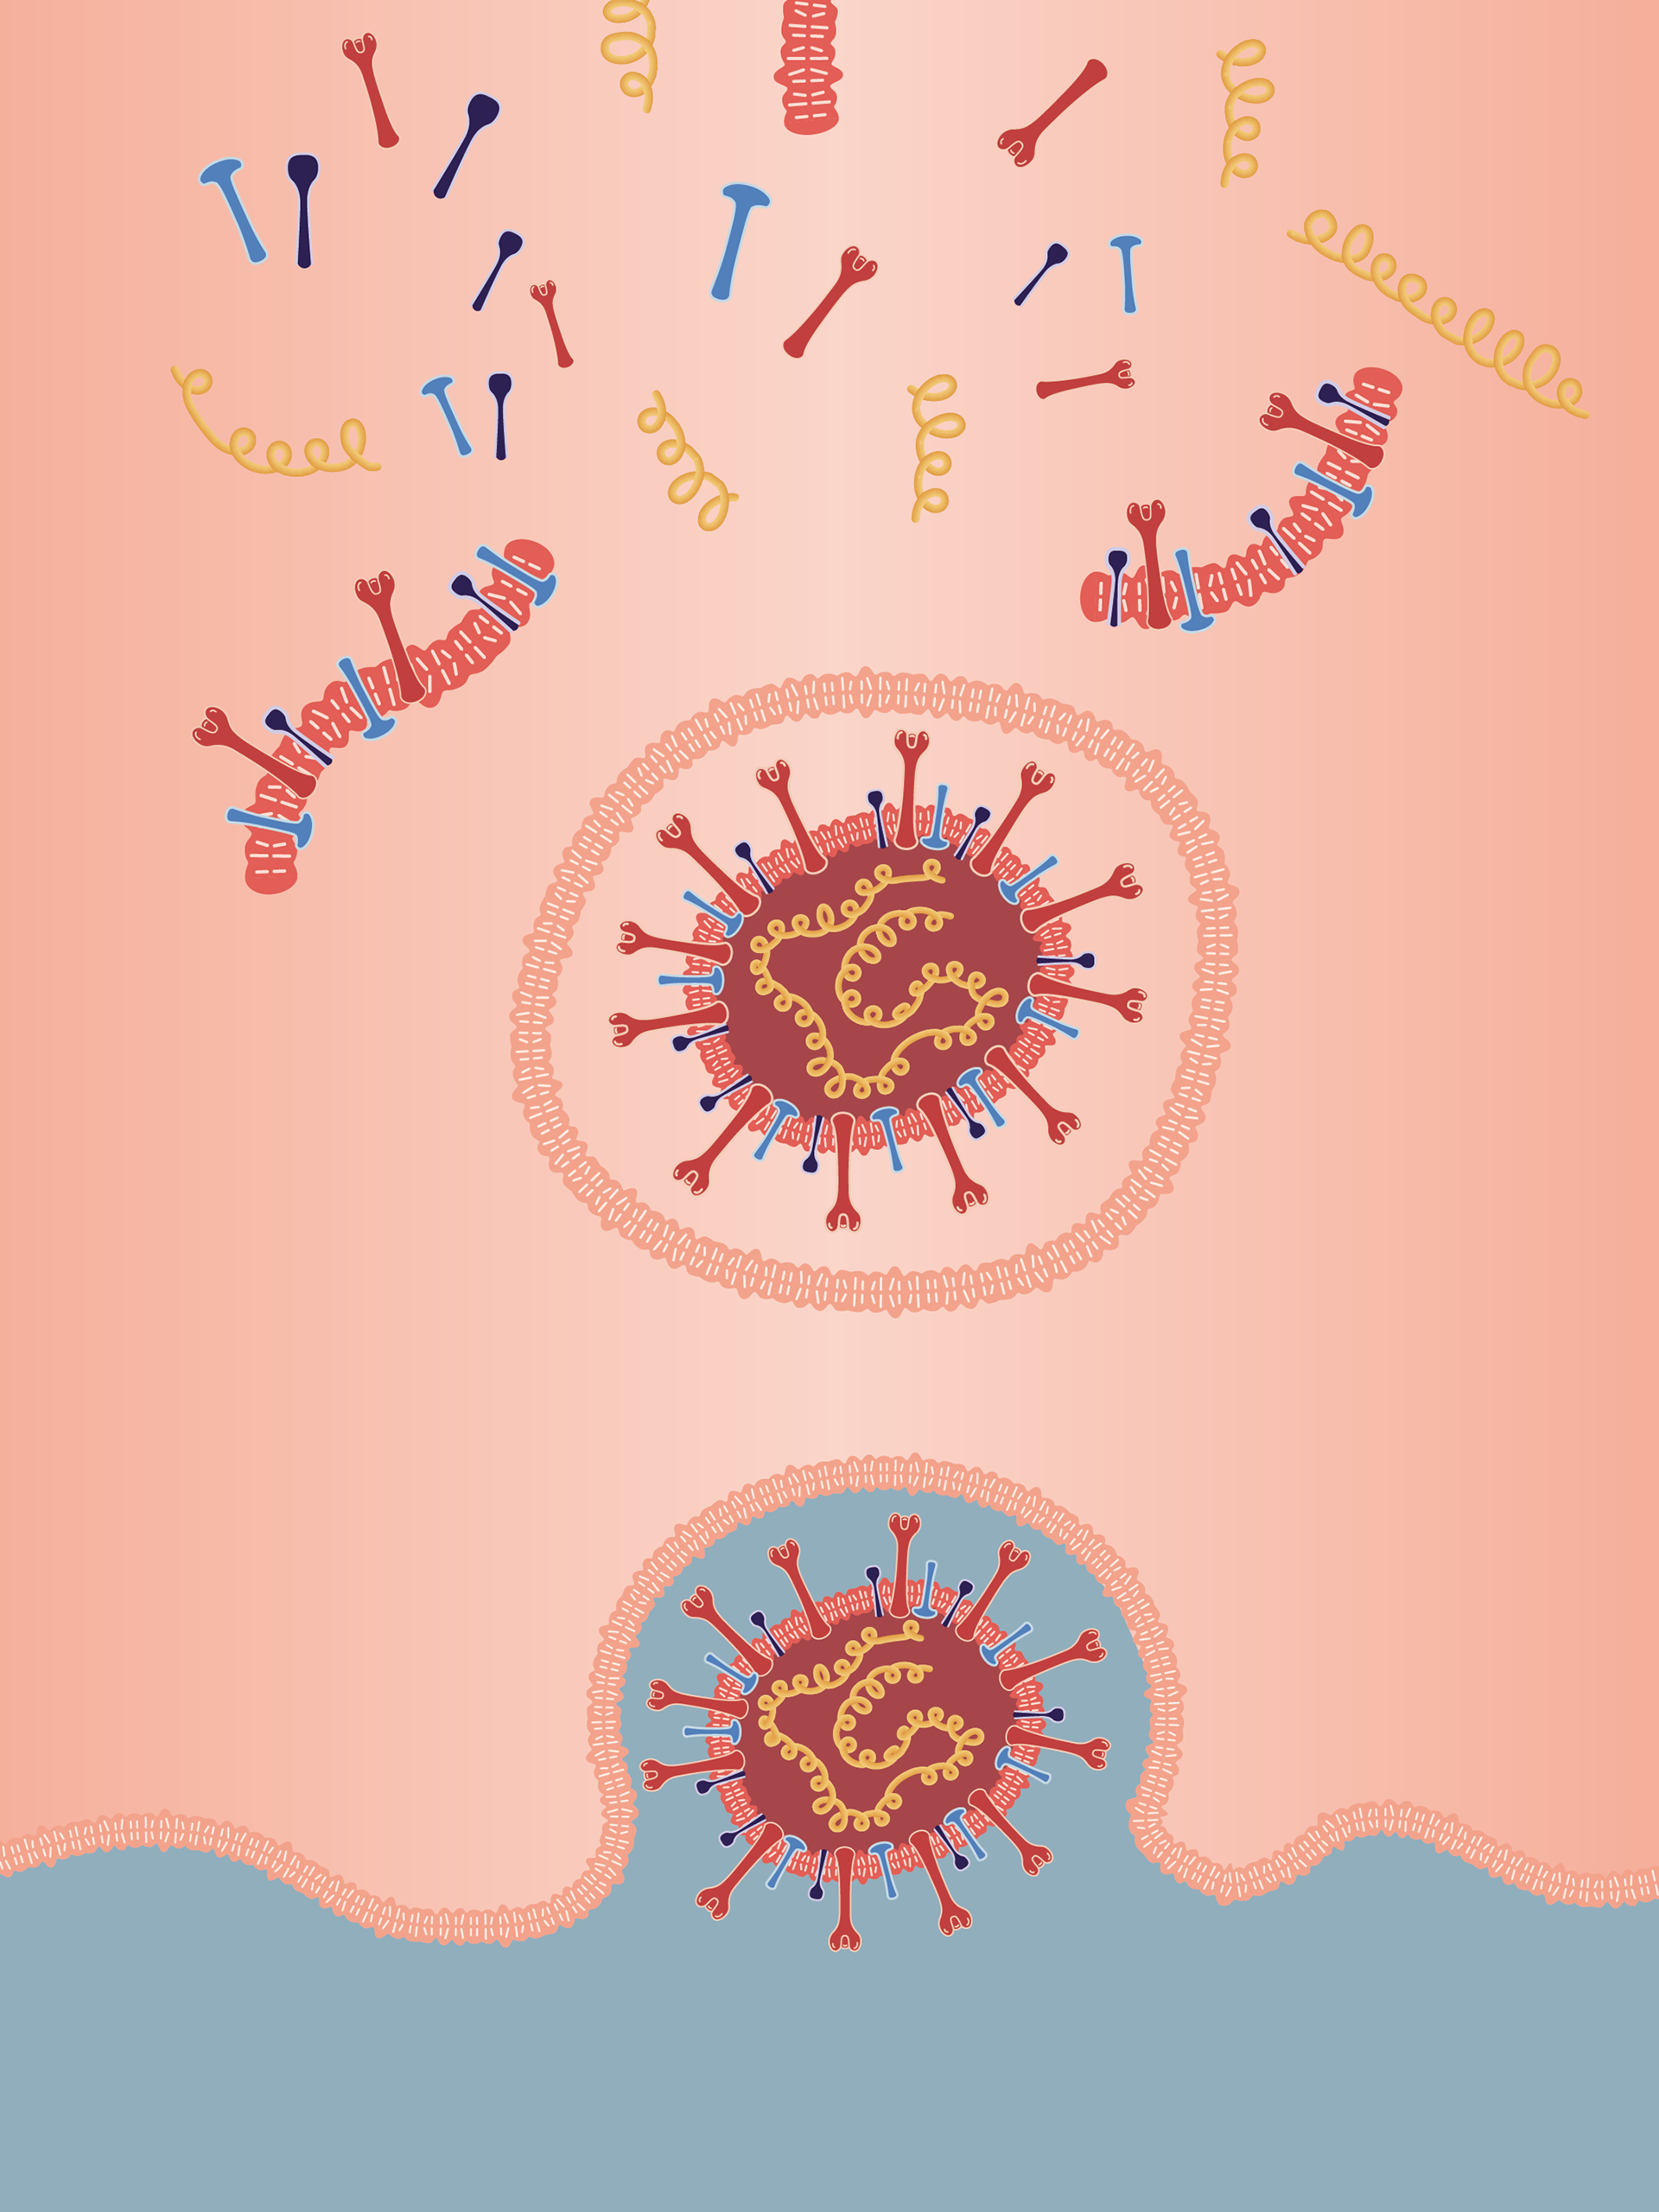
the virus docking process at the human cells.
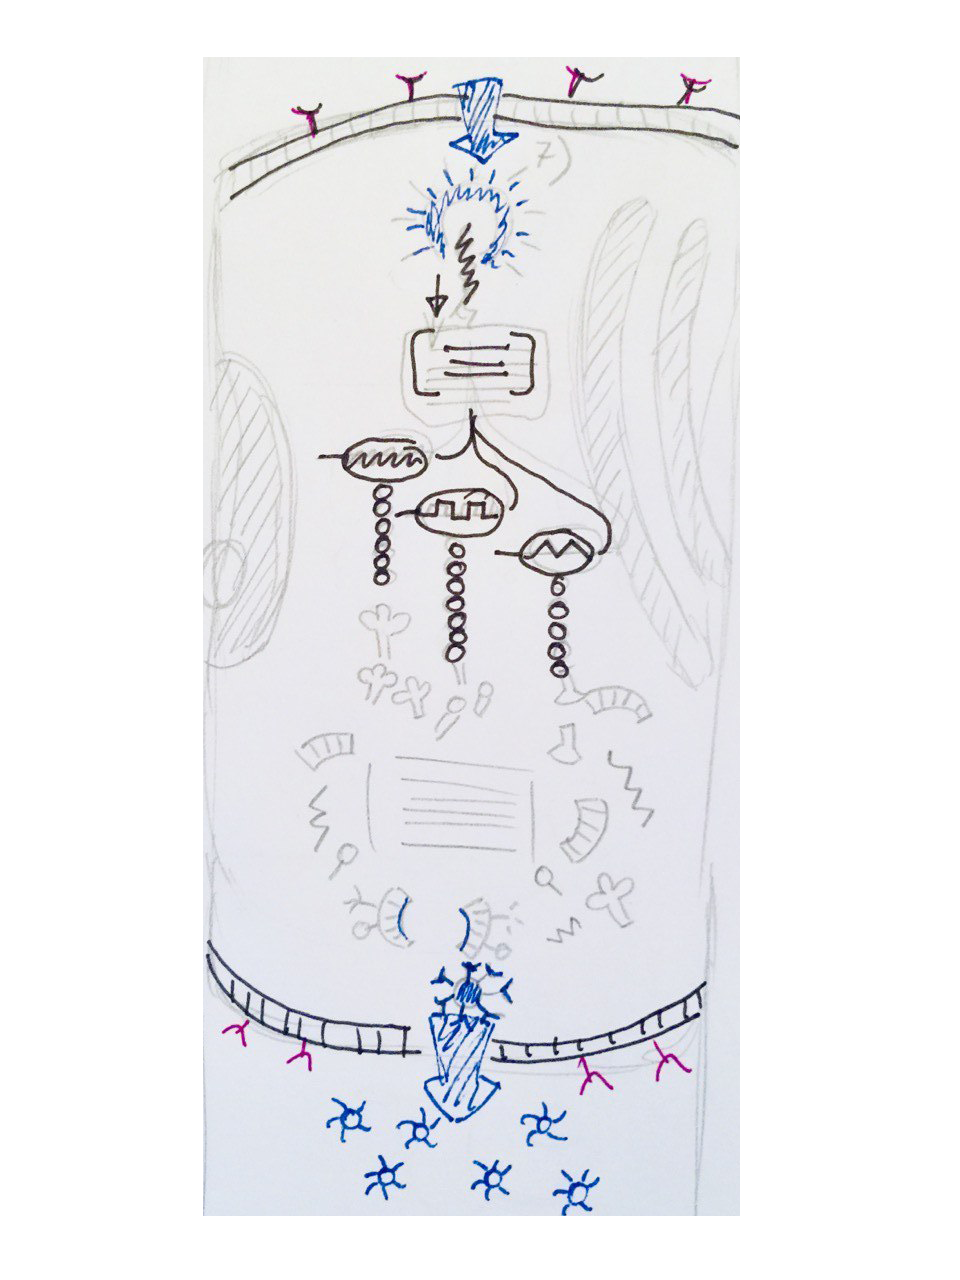
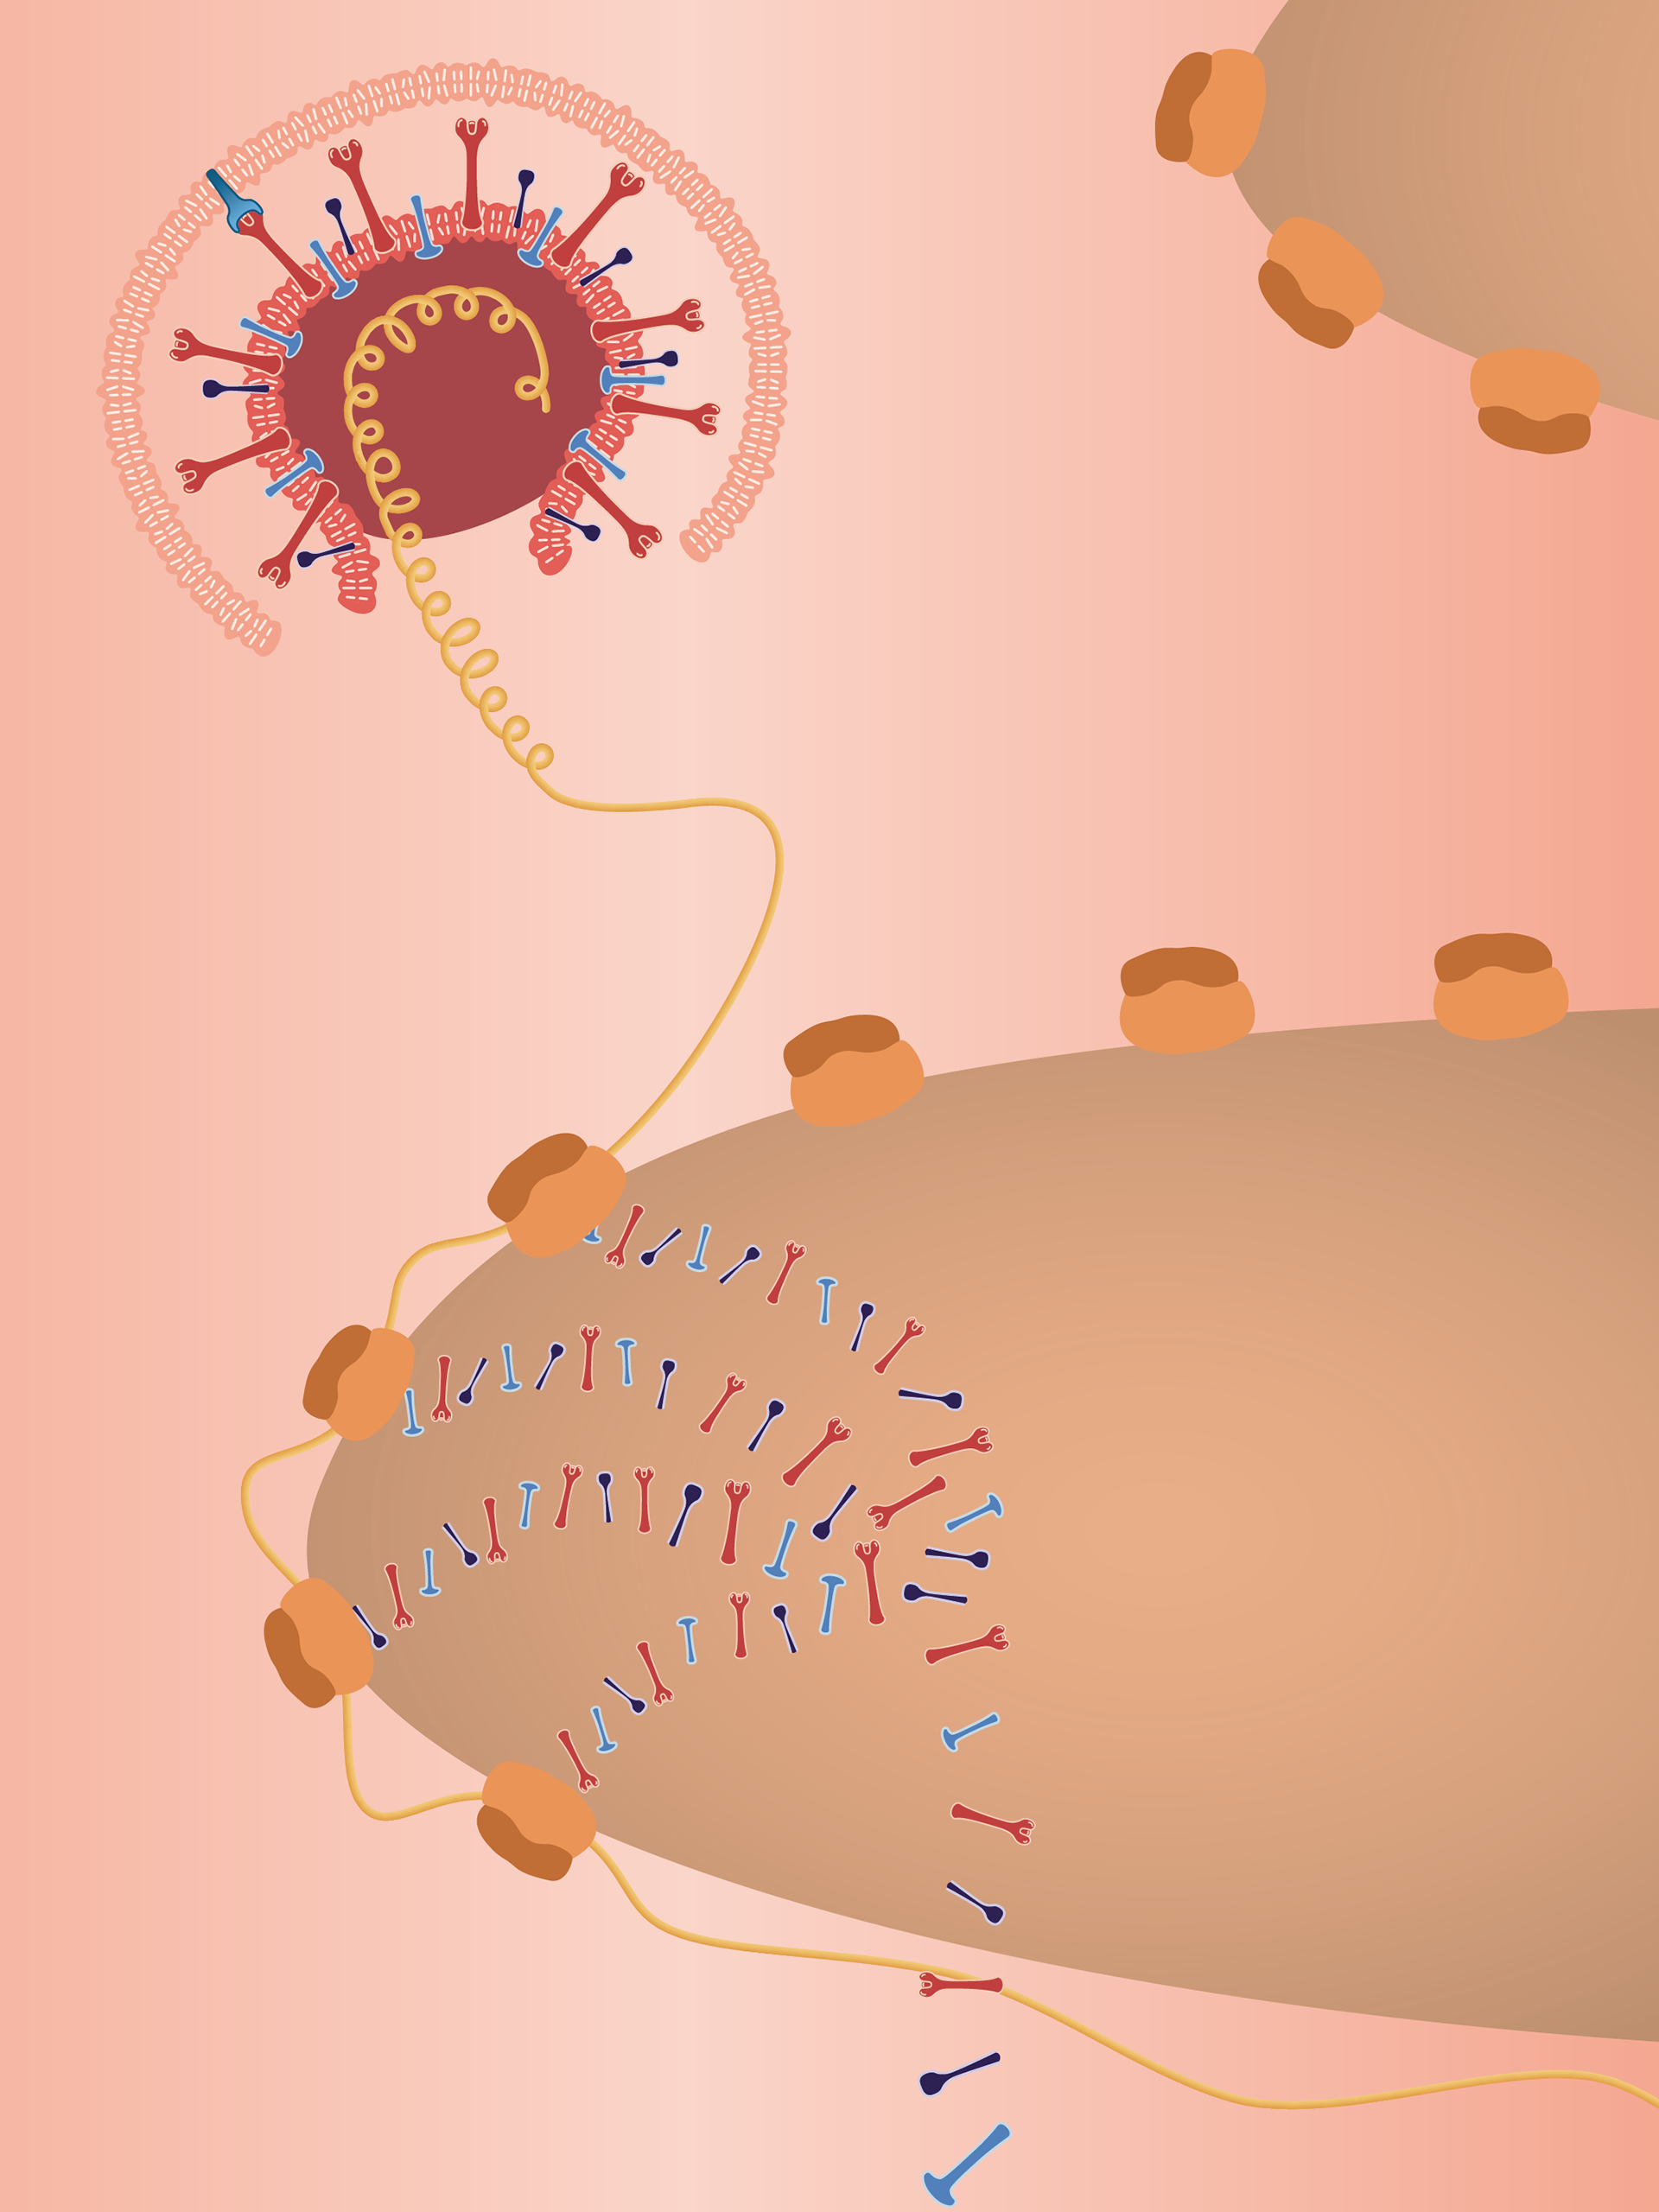
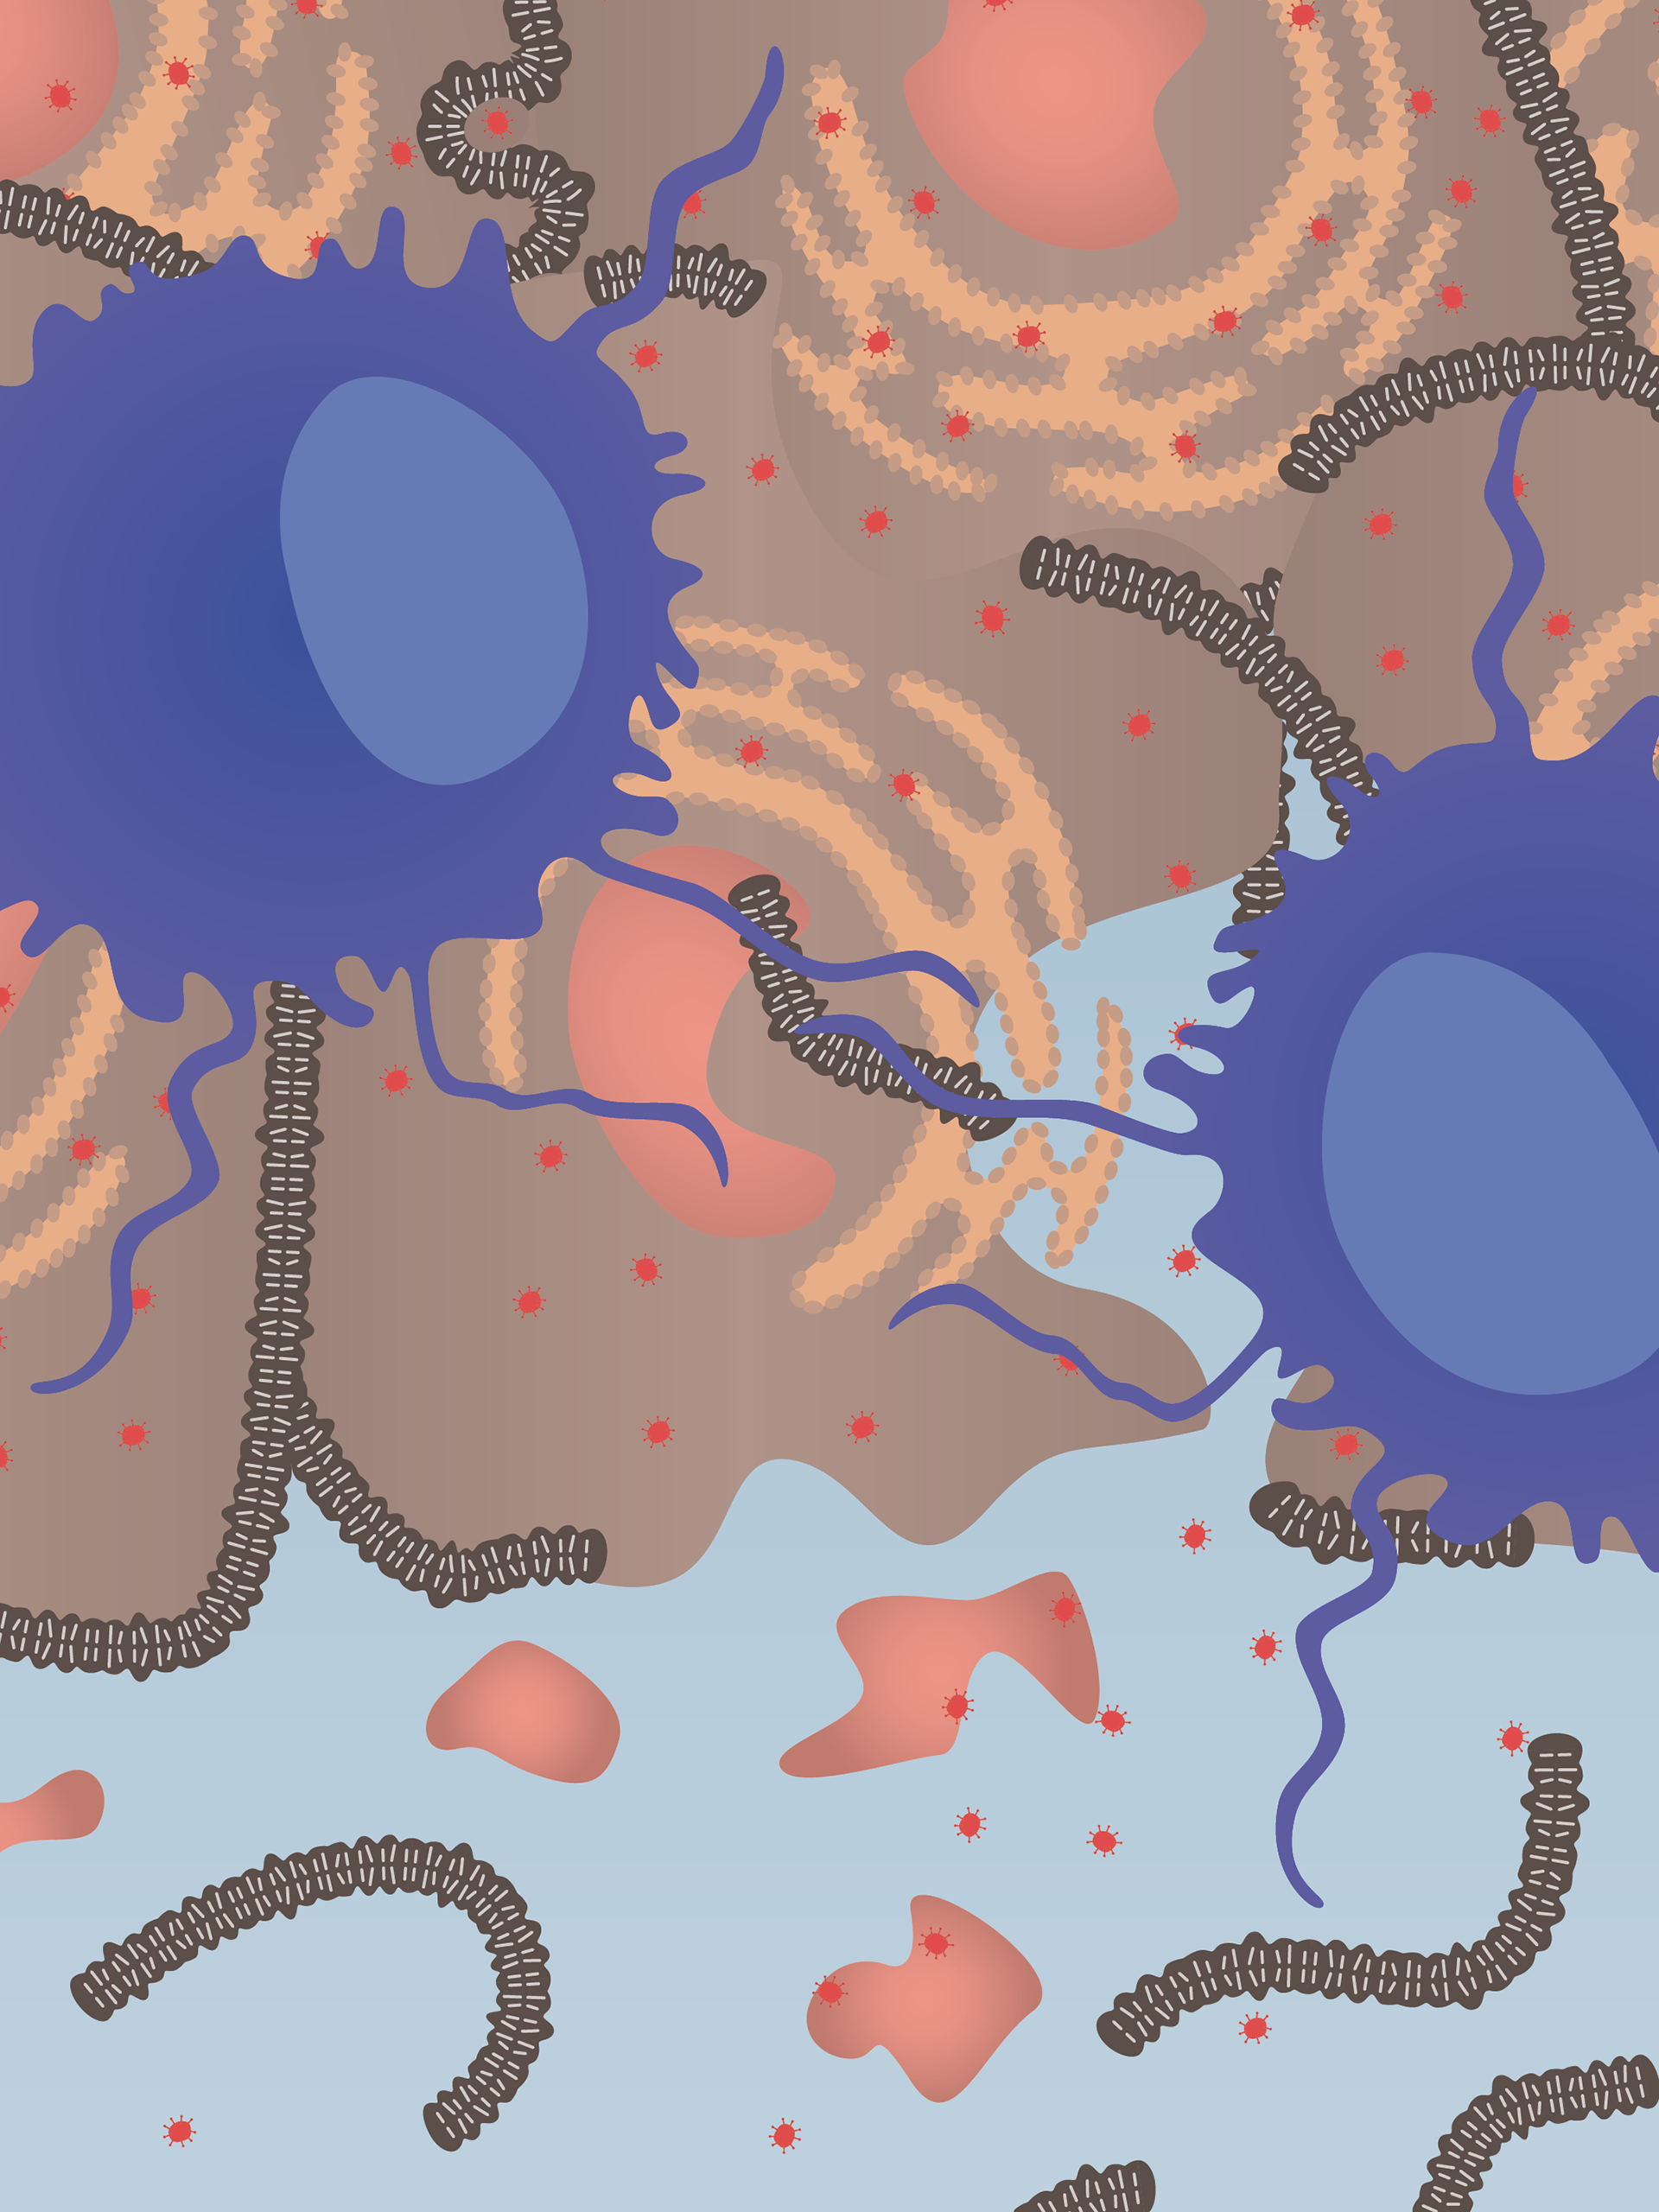
view inside the human cells and infection process.
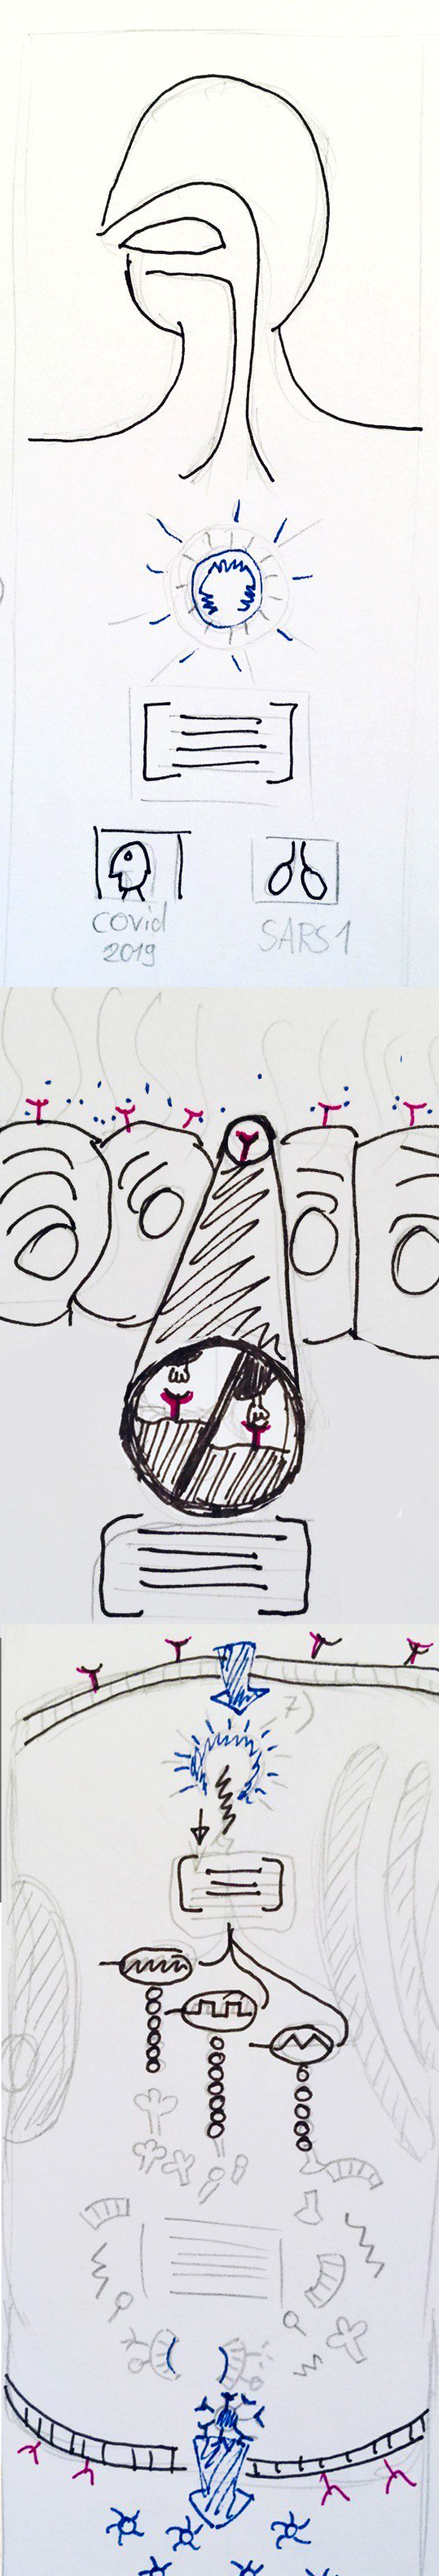
After conducting extensive research, I chose to create hand-drawn illustrations to achieve a more natural look for my graphics and find the perfect illustration.
The infographic was complex and required two sizes: mobile and desktop. Our Art Director helped with Illustrator file improvements.
The polishing process was supervised by the art director, Manuel Kostrzynski, and brought to life by David Meidinger.
Conclusion
Working for “Der Tagesspiegel” during the lockdown was tough. As an intern working from home, meeting the daily project deadlines was a big challenge. We missed the informal communication we used to have in the office, which made completing tasks take much longer.
Final Illustrations


Credits
Illustration & Research: Jens Ove Drößiger
Writing & Research: Helena Wittlich (Tagesspiegel)
Art Direction: Manuel Kostrzynski
Website Development: David Meidinger
Project Supervisor: Hendrik Lehmann
Writing & Research: Helena Wittlich (Tagesspiegel)
Art Direction: Manuel Kostrzynski
Website Development: David Meidinger
Project Supervisor: Hendrik Lehmann
Published Infographic by Tagesspiegel
https://interaktiv.tagesspiegel.de/lab/grafik-erklaerstueck-wie-das-coronavirus-den-koerper-befaellt/
https://interaktiv.tagesspiegel.de/lab/grafik-erklaerstueck-wie-das-coronavirus-den-koerper-befaellt/